
Описание
Pinescritlabs
Индикаторы Ctrader Store: 🤖Pinescritlabs Ctrader Store cBots:
Fair Value Gap Sessions Gold & BTC Breakout Session Pivots(new)
Dynamic Market Structure
Анализ поворотных точек
Fibonacci Linear
Регрессия на нескольких таймфреймах
Multi-Level Candle Bias
Трекер
Auto Support and
Resistance Trend Lines
All Support and
Resistance Levels
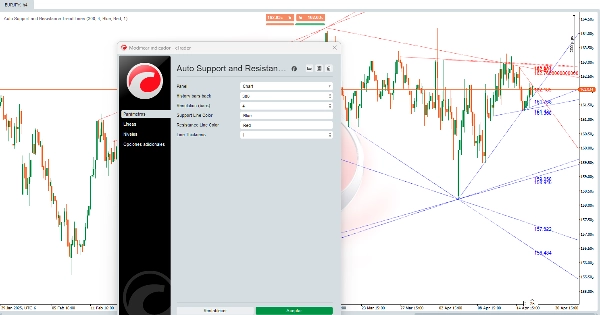
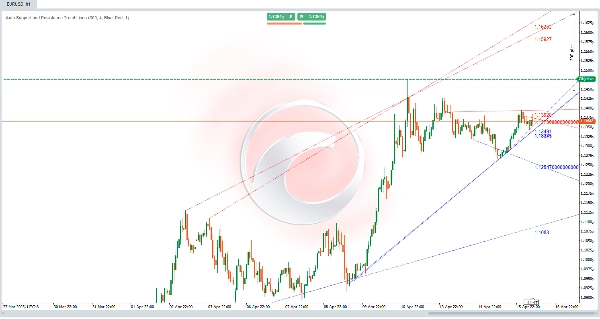
Автоматические линии поддержки и сопротивления тренда:
Этот алгоритм является мощным инструментом 🛠️, предназначенным для автоматического определения уровней поддержки и сопротивления на ценовом графике. Он не только рисует горизонтальные линии, но и проводит диагональные каналы ↗️↘️, которые отражают рыночные тренды. Эти уровни и каналы являются ключевыми зонами , где цена испытывала трудности с движением вверх (сопротивление 🚧) или вниз (поддержка 🛡️), что делает их важными точками для принятия торговых решений. 📈📉
Как выполняются расчёты? 🔍
Алгоритм использует анализ истории цен 📊 для определения уровней поддержки и сопротивления. Вот как это работает:
- Определение локальных минимумов и максимумов ⬇️⬆️
-
- Алгоритм анализирует цену за определённый диапазон баров (свечей), чтобы найти локальные минимумы (самые низкие цены в этом диапазоне) и локальные максимумы (самые высокие цены в этом диапазоне).
- Эти локальные минимумы и максимумы являются потенциальными кандидатами на уровни поддержки и сопротивления.
- Проверка уровней ✔️
-
- После определения локальных минимумов и максимумов алгоритм проверяет, были ли эти уровни учтены ценой в прошлом.
- Если цена касалась уровня несколько раз, не пробивая его явно, этот уровень считается действительным уровнем поддержки или сопротивления.
- Рисование линий и каналов ✏️
-
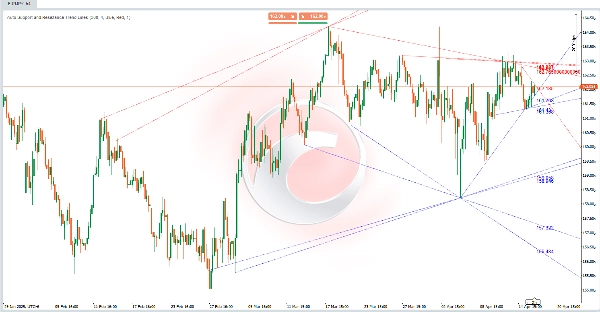
- Уровни поддержки рисуются как горизонтальные (или диагональные) линии на проверенных локальных минимумах.
- Уровни сопротивления рисуются как горизонтальные (или диагональные) линии на проверенных локальных максимумах.
- Кроме того, алгоритм соединяет эти уровни, формируя диагональные каналы ↗️↘️, которые отражают бычьи или медвежьи тренды на рынке.
- Динамическое обновление 🔄
-
- Индикатор автоматически обновляется с каждым новым баром, пересчитывая и перерисовывая уровни поддержки и сопротивления на основе последних ценовых данных.
Как этот алгоритм помогает трейдерам? 💡
Этот алгоритм является прорывом для трейдеров, потому что:
- Обеспечивает макрообзор рынка 🌐
-
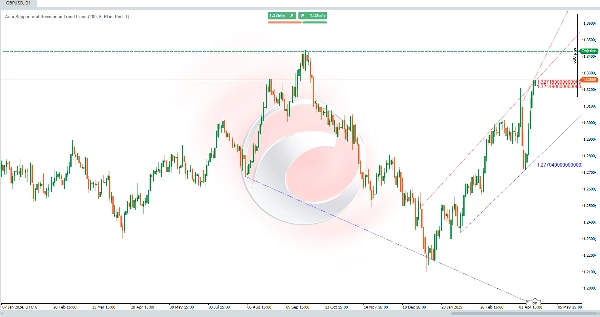
- Рисуя диагональные каналы, алгоритм показывает основные рыночные тренды, помогая трейдерам определить, находится ли цена в восходящем тренде 📈, нисходящем тренде 📉, или флэте ↔️.
- Определяет ключевые зоны поддержки и сопротивления 🎯
-
- Уровни поддержки и сопротивления — это зоны, где цена может отскочить или пробить. Эти уровни полезны для:
-
- Установки точек входа и выхода для сделок.
- Размещения стоп-лоссов 🛑 и тейк-профитов ✅.
- Определения пробоев 🚀 или разворотов 🔄 цены.
- Упрощает технический анализ 🕒
-
- Алгоритм автоматизирует процесс определения поддержки и сопротивления, экономя время трейдеров, которые обычно делают это вручную.
- Чёткое отображение уровней и каналов помогает трейдерам принимать более обоснованные решения.
- Настраиваемость 🎨
-
- Трейдеры могут настраивать параметры, такие как количество анализируемых исторических баров, толщина линий, и цвета, что позволяет адаптировать индикатор под разные стили торговли и визуальные предпочтения.
Практический пример 📌
Представьте, что вы анализируете ценовой график, и алгоритм нарисовал:
- диагональную линию поддержки ↗️, соединяющую несколько локальных минимумов, указывающую на восходящий тренд.
- диагональную линию сопротивления ↗️, соединяющую несколько локальных максимумов, показывающую восходящий канал.
- Несколько горизонтальных линий, представляющих ключевые уровни поддержки и сопротивления.
С этой информацией вы можете:
- Определить, что цена находится в восходящем тренде 📈.
- Искать возможности для покупки рядом с диагональной линией поддержки или горизонтальными уровнями поддержки.
- Установить стоп-лосс 🛑 ниже ближайшего уровня поддержки.
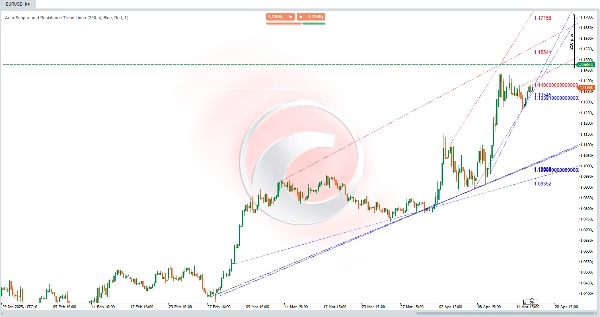
- Наблюдать, пробьёт ли цена уровень сопротивления, чтобы подтвердить продолжение тренда или возможный разворот 🔄.
Сводка
Once validated, support and resistance levels are drawn as horizontal or diagonal lines, and connected to form channels indicating bullish or bearish trends. The indicator updates dynamically with each new bar, recalculating and redrawing levels to reflect the most recent price behavior.
This tool aids traders by providing a macro view of market trends, identifying zones where price may bounce or break, and simplifying technical analysis through automation. It supports setting entry and exit points, stop-loss and take-profit orders, and spotting potential breakouts or reversals. Parameters such as the number of historical bars analyzed, line thickness, and colors can be customized to fit different trading styles and preferences.


