

Penerangan
📉 SMARTZIG — VISUALISER STRUKTUR PASAR TERUNGGUL ( VERSÃO 🇧🇷 BAIXO)
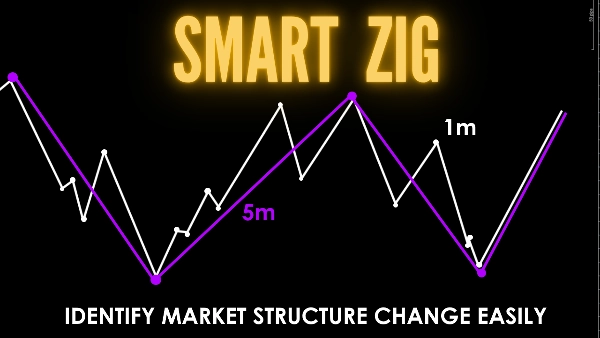
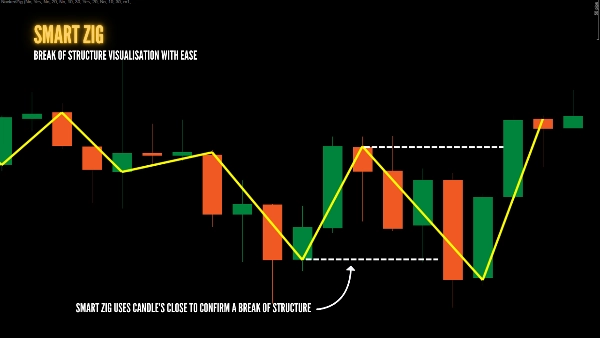
Baca tindakan harga seperti seorang profesional. SmartZig menghapus bunyi sumbu dengan memetakan struktur terus dari badan lilin (buka dan tutup). Elakkan pecahan palsu dengan meletakkan Bingkai Masa Lebih Rendah (LTF) pada ayunan Bingkai Masa Lebih Tinggi (HTF) secara serentak untuk mengenal pasti peralihan struktur pasaran dan perubahan dalam keadaan penghantaran (CISD) dengan lebih mudah, dapatkan tindakan harga yang disahkan dan sapuan kecairan dengan bergantung pada buka tutup dan bukannya sumbu. Sembunyikan bar carta untuk lebih kejelasan semasa melakukan analisis teknikal anda.
✅ MENGAPA NAIK TARAF KE SMARTZIG?
- Enjin Zigzag Berganda: Jalankan dua ZigZag bebas untuk melihat tren pantas dan perlahan pada masa yang sama.
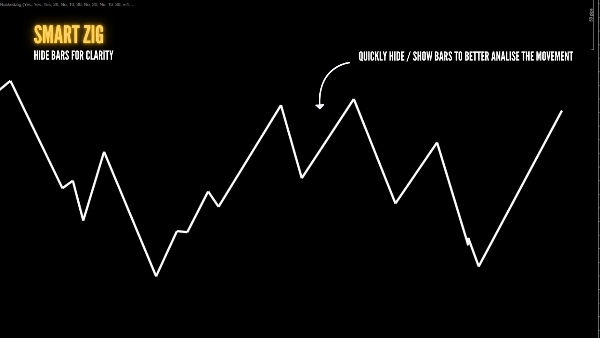
- Mod Carta Bogel: Sembunyikan semua bar lilin dengan satu klik untuk fokus sepenuhnya pada rangka ZigZag.
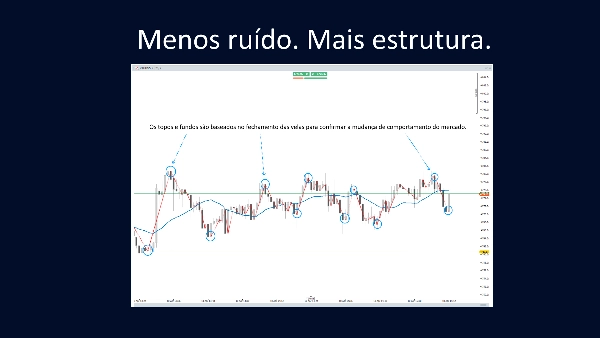
- Ketepatan Berasaskan Badan: Pivots diperoleh dari tahap Buka/Tutup, mengelakkan pecahan sumbu palsu.
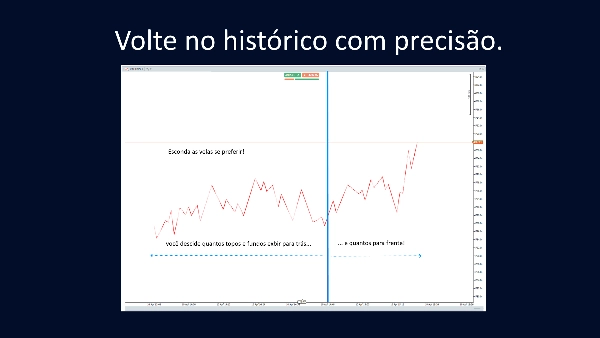
- Sejarah Interaktif: Seret sauh menegak untuk segera mendedahkan kaki struktur dalam mana-mana sesi lalu.
- Bingkai Masa Bebas: Tetapkan tempoh sumber berbeza untuk LTF dan HTF tanpa menukar carta.
- Pelaksanaan Bersih: Berhenti melukis secara manual dan biarkan penunjuk mengemas kini ayunan anda secara masa nyata.
📺 TONTON TUTORIAL & SERTAI KOMUNITI:
(Sila poskan soalan/permintaan sokongan anda dalam komen video untuk membantu komuniti kami berkembang!)
🛠️ CIRI UTAMA:
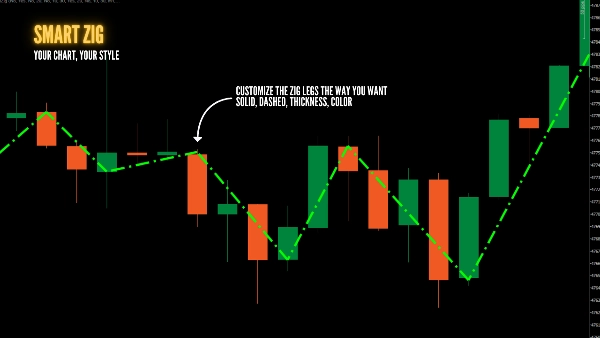
- Gaya Boleh Disesuaikan: Warna, ketebalan, dan gaya garis berasingan untuk setiap ZigZag.
- Penapisan Kaki: Pilih dengan tepat berapa banyak kaki sejarah yang anda mahu lihat.
- Sauh Boleh Seret: Pindahkan fokus kajian ke mana-mana bar sejarah dengan tetikus anda.
- Togol Kebolehlihatan Penuh: Sembunyikan atau tunjukkan keseluruhan kajian dengan serta-merta untuk membersihkan skrin anda.
🇧🇷 SMARTZIG — PENUNJUK VISUAL STRUKTUR PASARAN TERUNGGUL
Analisis tindakan harga (Price Action) seperti seorang profesional. SmartZig menghapuskan bunyi sumbu dengan memetakan struktur terus dari badan lilin (buka dan tutup). Elakkan pecahan palsu dengan meletakkan pergerakan Bingkai Masa Lebih Rendah (LTF) pada Bingkai Masa Lebih Tinggi (HTF) secara serentak untuk mengenal pasti perubahan struktur pasaran dan perubahan dalam keadaan penghantaran (CISD) dengan lebih mudah. Dapatkan pengesahan tindakan harga dan sapuan kecairan berdasarkan buka dan tutup, bukan sumbu. Sembunyikan bar carta untuk lebih kejelasan semasa analisis teknikal anda.
✅ MENGAPA NAIK TARAF KE SMARTZIG?
- ZigZag Berganda: Jalankan dua ZigZag bebas untuk melihat tren pantas dan perlahan pada masa yang sama.
- Mod Carta Bersih: Sembunyikan semua lilin dengan satu klik dan fokus hanya pada "rangka" pasaran.
- Ketepatan Berdasarkan Badan: Pivots diperoleh dari Buka/Tutup, mengelakkan pecahan sumbu palsu.
- Interaktiviti Sejarah: Seret sauh menegak untuk mendedahkan kaki struktur dalam mana-mana sesi lalu.
- Bingkai Masa Bebas: Tetapkan tempoh sumber berbeza untuk LTF dan HTF tanpa menukar carta.
- Pelaksanaan Pantas: Berhenti melukis ayunan secara manual; biarkan penunjuk mengemas kini struktur secara masa nyata.
📺 TONTON TUTORIAL DAN JAWAB PERTANYAAN ANDA:
(Sila poskan soalan dan permintaan sokongan anda dalam komen video di atas untuk membantu sebanyak mungkin orang!)
🛠️ CIRI TEKNIKAL UTAMA:
- Gaya Boleh Disesuaikan: Warna, ketebalan, dan gaya garis bebas untuk setiap ZigZag.
- Penapisan Kaki: Pilih dengan tepat berapa banyak kaki sejarah yang anda mahu lihat.
- Sauh Boleh Seret: Pindahkan fokus kajian ke mana-mana bar sejarah menggunakan tetikus.
- Togol Kebolehlihatan Penuh: Sembunyikan atau tunjukkan keseluruhan kajian dengan serta-merta untuk membersihkan skrin anda.
Ringkasan
Key features include a dual ZigZag engine that tracks fast and slow trends independently, customizable styling for colors and line thickness, and interactive history with draggable vertical anchors to explore past structural legs. It supports independent timeframe settings for LTF and HTF without switching charts and updates swings in real-time, eliminating the need for manual drawing. Additional functionalities include leg filtering to control the number of visible historical legs and a full visibility toggle to declutter the chart.
SmartZig is tagged for key levels, break of structure (BOS), liquidity sweeps and grabs, change of character (CHOCH), market structure, and support/resistance analysis. It provides a visual tool for technical analysts to read price action more accurately and confirm liquidity events based on open-close pivots. A tutorial video is available for user guidance.
Ulasan pelanggan
Perbincangan
Soalan Lazim





















Harga