

설명
TRADELENS - 컨텍스트 유지. 세부 사항 확인.
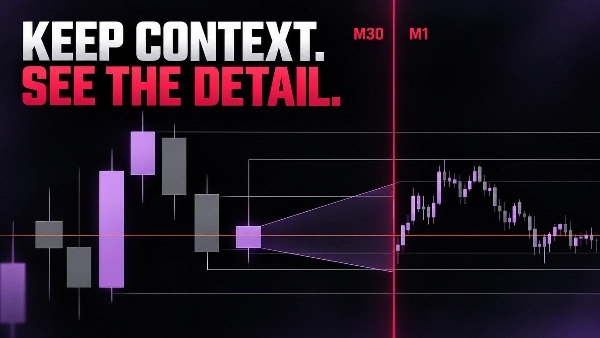
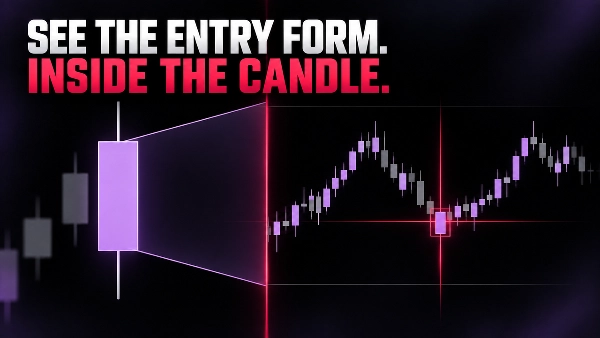
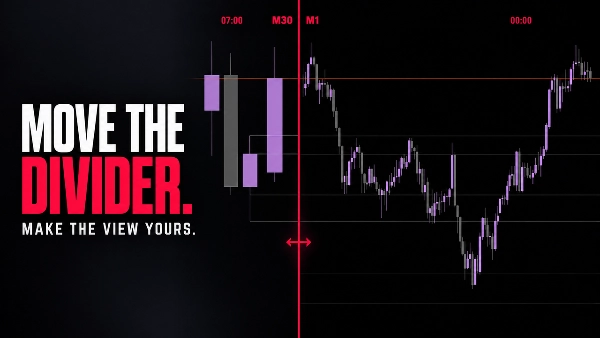
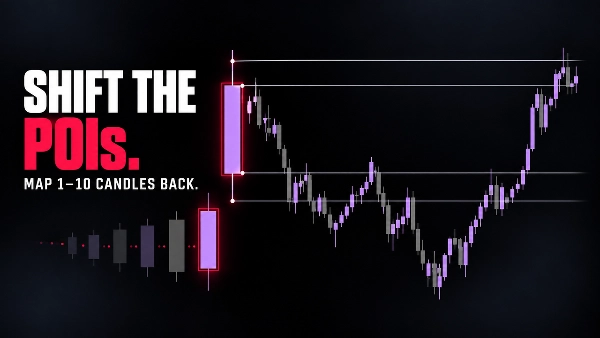
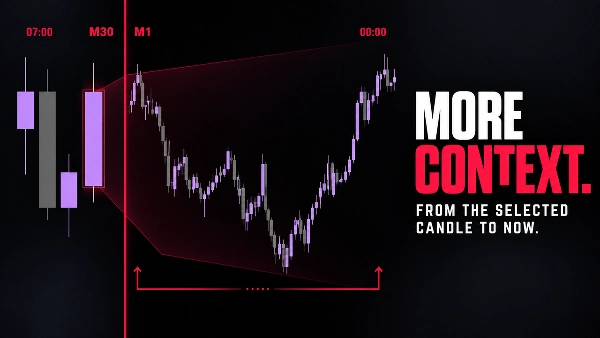
TradeLens는 현재 차트 내에 컴팩트한 하위 타임프레임 캔들 뷰를 직접 배치합니다. 원래 차트는 더 높은 타임프레임의 컨텍스트로 유지되며, 세부 패널은 선택한 컨텍스트 캔들 내에서 가격이 어떻게 전개되고 있는지 보여줍니다.
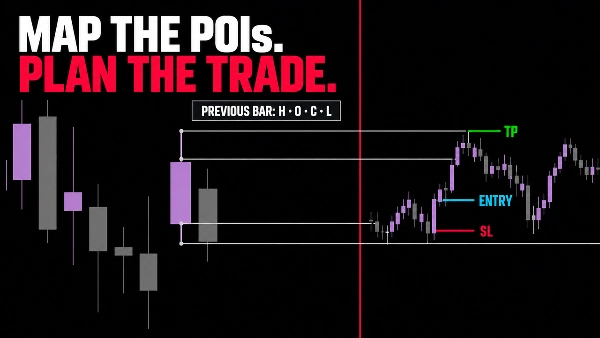
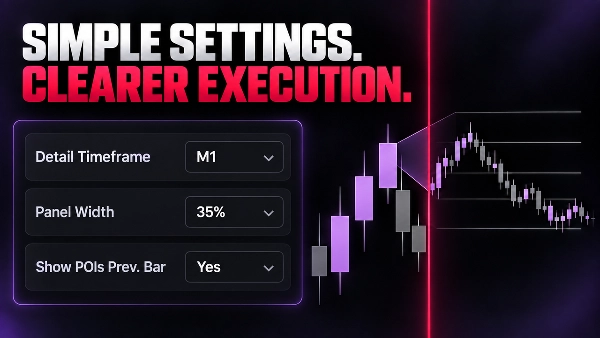
기본적으로 현재 형성 중인 캔들을 사용하거나 이전 컨텍스트 캔들을 검사하기 위해 뒤로 이동할 수 있습니다. 이전 마감 바의 고가, 저가, 시가 및 종가에 선택적 POI(레이)를 설정하여 활성 설정을 프레임화한 다음, 차트를 벗어나지 않고 하위 타임프레임 움직임을 연구할 수 있습니다.
TRADELENS가 보여주는 것
- 같은 창에서 더 높은 타임프레임 구조와 더 낮은 타임프레임 세부 사항.
- 더 세밀한 규모로 현재 컨텍스트 캔들의 진행 상황.
- 차트 전반에 걸친 이전 바의 OHLC 관심 지점.
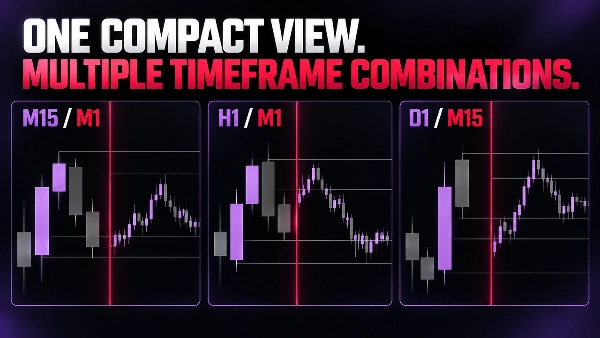
- M15/M1, M30/M1, H1/M1, D1/M15 및 D1/M30과 같은 컴팩트한 조합.
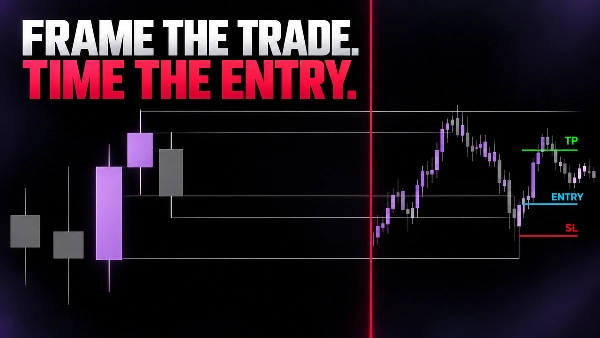
- 컨텍스트를 유지하면서 진입 타이밍을 정제하는 더 깔끔한 방법.
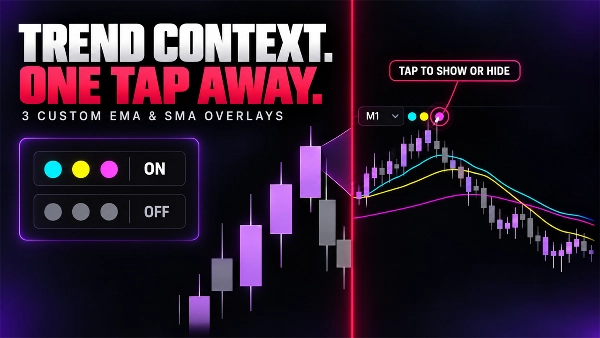
- 최대 세 개의 사용자 정의 가능한 EMA 또는 SMA 오버레이 추가.
- 한 번의 탭으로 각 평균을 즉시 표시하거나 숨기기.
- 하위 타임프레임 뷰 내에서 직접 추세 방향 확인.
간단하고 시각적인 컨트롤
- 세부 타임프레임 및 컨텍스트 캔들 이동.
- 세부 패널 너비, 배경 및 불투명도.
- 강세, 약세, 구분선 및 라벨 색상.
- 구성 가능한 색상과 두께를 가진 선택적 이전 바 POI.
세부 타임프레임은 차트 타임프레임보다 작아야 합니다. 조합이 유효하지 않으면 TradeLens는 시각화를 숨기고 명확한 구성 배너를 표시합니다.
TradeLens는 시각적 분석 도구입니다. 주문을 배치, 수정 또는 관리하지 않습니다. 갤러리에 표시된 예시는 차트 읽기 워크플로우를 설명하며 거래 권장이나 성능 보증이 아닙니다.
요약
AI summary
TradeLens is a chart visualization tool designed to integrate two timeframes within a single trading chart. It embeds a compact lower-timeframe candle view inside the current higher-timeframe chart, allowing traders to observe detailed price action within the context of a broader market structure. Users can analyze the progression of the current or previous context candles at a finer scale without switching charts.
Key features include optional points of interest (POIs) marking the previous bar’s Open, High, Low, and Close levels, customizable visual settings such as detail panel size, background opacity, and color schemes for bullish, bearish, and separator elements. TradeLens supports common timeframe combinations like M15/M1, M30/M1, H1/M1, D1/M15, and D1/M30, ensuring the detail timeframe is always smaller than the context timeframe.
This tool facilitates refined entry timing by preserving higher-timeframe context while providing granular lower-timeframe insights. It is a visual analysis indicator and does not execute or manage trades. TradeLens is tagged under market structure and chart UI tools, supporting analysis related to key levels, liquidity sweeps, market structure changes, and inducements.
Key features include optional points of interest (POIs) marking the previous bar’s Open, High, Low, and Close levels, customizable visual settings such as detail panel size, background opacity, and color schemes for bullish, bearish, and separator elements. TradeLens supports common timeframe combinations like M15/M1, M30/M1, H1/M1, D1/M15, and D1/M30, ensuring the detail timeframe is always smaller than the context timeframe.
This tool facilitates refined entry timing by preserving higher-timeframe context while providing granular lower-timeframe insights. It is a visual analysis indicator and does not execute or manage trades. TradeLens is tagged under market structure and chart UI tools, supporting analysis related to key levels, liquidity sweeps, market structure changes, and inducements.
지표 프로필
지표 카테고리
시장 구조 (SMC)
출력 유형
시각화
데이터 요구 사항
막대만
고객 리뷰
5.0
리뷰: 1
5 | 100 % | |
4 | 0 % | |
3 | 0 % | |
2 | 0 % | |
1 | 0 % |
고객 리뷰
October 4, 2026
TradeLens displayed an embedded M1 candle view on EURUSD H1 and XAUUSD H1, M10 and Month1. Three moving averages, timeframe labels and the separator were visible. The invalid M1/M1 combination correctly triggered a clear warning. The interface works well, although low contrast and compressed detail candles can affect readability, especially on higher timeframes.
상담
자주 묻는 질문(FAQ)
Chart UI Tools
Key Levels
Liquidity Sweep
CHOCH
Inducement
Market Structure
Liquidity Grab
트레이딩 봇, 지표, 플러그인 등 cTrader Store에서 제공되는 상품은 제3자 개발자에 의해 제공되며, 이는 단순히 정보 및 기술적 접근을 목적으로 제공된 것입니다. cTrader Store는 중개인이 아니며, 투자 조언, 개인별 추천 또는 향후 성과에 대한 어떠한 보장도 제공하지 않습니다.























가격

가입일 09/02/2026
26
판매
167
무료 설치