
Descripción
Indicadores de Pinescriptlabs Store: cBots de Pinescriptlabs Store : (cBot) Gold & BTC BreakoutSession Pivots(nuevo)
PRICE ACTION (Nuevo)
Trailing Smart Algorithm (Nuevo)
Mapa de Liquidación de Apalancamiento
Predicción Basada en Linreg & ATR
Soporte y Resistencia SmartTrend
Líneas
Sesiones de Brecha de Valor Justo
Análisis
Dinámico de Estructura
de Mercado
de
Puntos
de Giro
Regresión
Lineal
Fibonacci
Multitemporal
Brecha de Valor Justo de Momentum
Proyección del Flujo del Mercado
Gradiente de Tendencia Dinámico
Rastreador
de Sesgo
de Velas Multi-Nivel
Rastreador de Extremos Zig-Zag
Soporte
y Resistencia
Automáticos
de Tendencia
Líneas
Todos
los Soportes y
Resistencias
Niveles
Descripción:
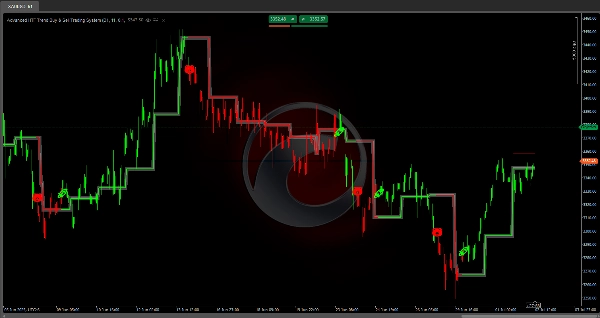
Sistema Avanzado de Compra y Venta de Tendencia HTF
¿Qué es y para qué sirve?
Es un algoritmo de análisis técnico que identifica automáticamente niveles de soporte y resistencia 📈 basados en rangos históricos de precios, y detecta cuando el precio rompe estos niveles para generar señales de tendencia 💡.
¿Cómo funciona la lógica?
1️⃣ Cálculo del Rango
El indicador analiza un período histórico definido (totalmente configurable) para encontrar:
• El precio más alto alcanzado en ese período 📊
• El precio más bajo alcanzado en ese período 📉
• El punto medio entre ambos niveles ⚖️
2️⃣ Establecimiento de Niveles
Una vez identificados los extremos, el indicador:
• Dibuja una línea roja en el nivel máximo (resistencia)
• Dibuja una línea verde en el nivel mínimo (soporte)
• Añade un margen de seguridad a cada nivel para evitar señales falsas 🛡️
3️⃣ Detección de Rupturas
El sistema monitorea constantemente el precio para detectar:
• Ruptura alcista 🚀: cuando el precio cierra por encima del nivel de resistencia + margen
• Ruptura bajista 🐻: cuando el precio cierra por debajo del nivel de soporte - margen
4️⃣ Sistema de Confirmación
Antes de generar una señal final ✅, el indicador:
• Espera un número configurable de barras consecutivas que confirmen la ruptura ⏳
• Solo después de la confirmación cambia oficialmente la tendencia
5️⃣ Actualización Dinámica
Los niveles se recalculan automáticamente:
• Cuando comienza un nuevo período (diario, semanal o mensual, según tu configuración) 🔄
• Las líneas se extienden hasta que se establecen nuevos niveles
• La línea del punto medio cambia de color según la tendencia actual
¿Cómo usar el ?
✨ Señales:
• Comprar: El símbolo 🚀 aparece cuando se confirma una ruptura alcista
• Vender: El símbolo 🐻 aparece cuando se confirma una ruptura bajista
🎨 Coloración de Velas:
• Las velas se colorean automáticamente según la tendencia actual:
✅ Verde: Tendencia alcista activa
❌ Rojo: Tendencia bajista activa
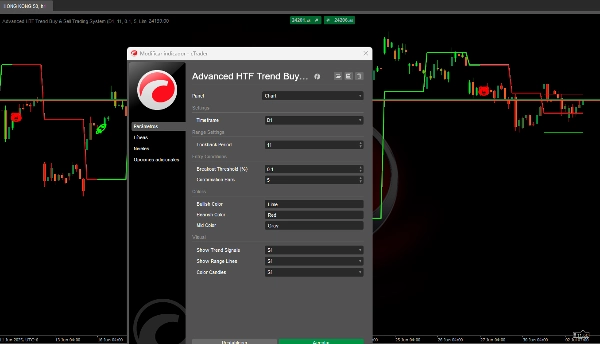
Configuración de Parámetros
🔧 Período de Retrospectiva (5–200, por defecto: 11)
¿Qué controla?
El número de barras históricas usadas para calcular máximos y mínimos.
Impacto al modificar:
• Valores bajos (5–15):
- Niveles más reactivos y frecuentes
- Mayor número de señales
- Ideal para scalping y operaciones a corto plazo
- Ideal para mercados altamente volátiles
• Valores altos (30–50):
- Niveles más estables y duraderos 🏛️
- Menos señales pero más fiables
- Mejor para swing trading y posiciones a medio plazo
- Ideal para mercados más estables
📏 Umbral de Ruptura (0.01–5.0%, por defecto: 0.1%)
¿Qué controla?
El margen adicional que el precio debe superar para confirmar una ruptura.
Impacto al modificar:
• Valores bajos (0.05–0.15%):
- Señales más tempranas y sensibles 🔍
- Mayor riesgo de rupturas falsas
- Ideal para Forex majors con spreads bajos
- Mejor para mercados con alta liquidez
• Valores altos (0.3–1.0%):
- Señales más tardías pero más fiables 🛡️
- Menor riesgo de ruido de mercado
- Ideal para criptomonedas y activos volátiles
- Mejor para mercados con spreads más amplios
⏳ Barras de Confirmación (1–5, por defecto: 1)
¿Qué controla?
Cuántas barras consecutivas deben confirmar la ruptura antes de generar una señal.
Impacto al modificar:
• 1 barra:
- Señales instantáneas ⚡
- Más oportunidades de trading
- Mayor riesgo de señales prematuras
- Ideal para traders activos
• 2–3 barras:
- Equilibrio entre velocidad y fiabilidad ⚖️
- Reduce significativamente las señales falsas
- Ideal para la mayoría de las estrategias
• 4–5 barras:
- Señales muy conservadoras 🕊️
- Fiabilidad máxima
- Puede perder oportunidades tempranas
- Ideal para posiciones a largo plazo
📊 Optimización por Tipo de Activo
💱 Forex Majors (EUR/USD, GBP/USD, etc.)
• Retrospectiva: 15–25
• Umbral: 0.05–0.15%
• Confirmación: 1–2 barras
💰 Criptomonedas
• Retrospectiva: 10–20
• Umbral: 0.2–0.8%
• Confirmación: 2–3 barras
📈 Índices Bursátiles
• Retrospectiva: 20–30
• Umbral: 0.1–0.3%
• Confirmación: 1–2 barras
🌾 Materias Primas
• Retrospectiva: 25–35
• Umbral: 0.15–0.4%
• Confirmación: 2–3 barras
Consideraciones
• Puede generar señales tardías en mercados muy rápidos 🏃♂️
• Menos efectivo en mercados extremadamente laterales
• Requiere ajustes de parámetros según activo y marco temporal ⏱️
Resumen
The system continuously monitors price action to detect bullish breakouts (price closing above resistance plus buffer) and bearish breakouts (price closing below support minus buffer). It includes a confirmation mechanism that waits for a configurable number of consecutive bars confirming the breakout before officially signaling a trend change. The midpoint line changes color to reflect the current trend, and all levels update dynamically at the start of new periods (daily, weekly, or monthly).
Signals are visually indicated with symbols: a rocket (🚀) for confirmed bullish breakouts and a bear (🐻) for confirmed bearish breakouts. Candles are colored green for active bullish trends and red for bearish trends.
Key adjustable parameters include lookback period (5–200 bars), breakout threshold buffer (0.01–5.0%), and confirmation bars (1–5). These settings can be optimized for various asset types such as Forex majors, cryptocurrencies, stock indices, and commodities, balancing signal frequency, reliability, and market conditions. The indicator supports multiple timeframes and is suitable for scalping, swing trading, and longer-term strategies depending on configuration.