
الوصف
مؤشر وقت التعادل الإصدار 2
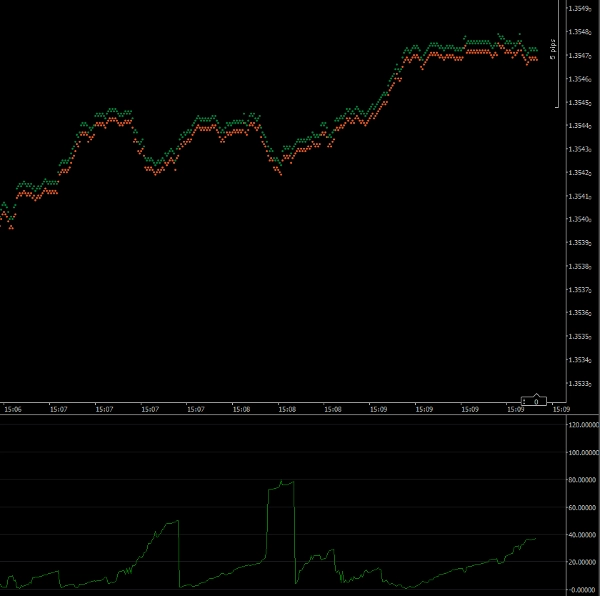
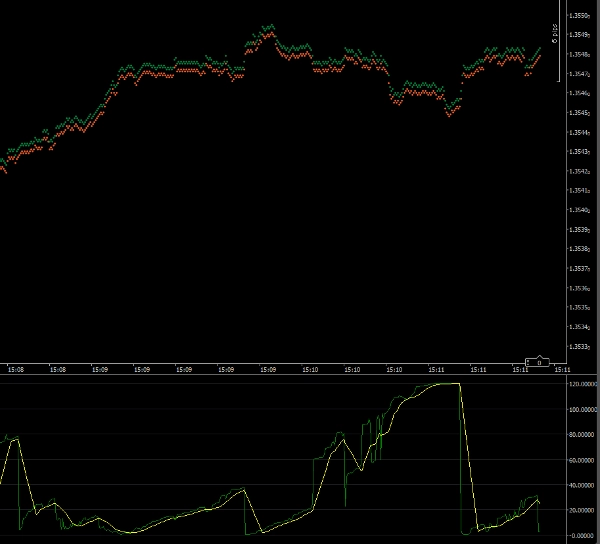
سيساعدك هذا المؤشر في توقيت دخول تداولك إلى السوق. يعرض الرسم البياني العدد المحتمل من الثواني التي يحتاجها تداولك ليصل إلى نقطة التعادل. إذا كان السوق يتحرك بسرعة وفي اتجاهك، فسيعطي المؤشر رقمًا صغيرًا. إذا كان السوق يتحرك ضدك أو ببطء، فسيكون الرقم أكبر.
يحسب المؤشر عدد النقاط التي يحتاجها تداولك ليصل إلى نقطة التعادل. ثم يقارن هذا بالسرعة الحالية التي يتحرك بها السعر.
ملاحظة: يجب تشغيل هذا المؤشر على إطار زمني 1 تيك.
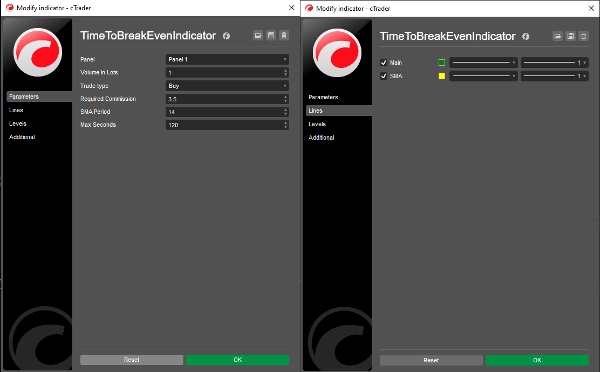
المعلمات
الحجم باللوتات: حجم تداولك المقترح
نوع التداول: سواء كان تداولك شراء أو بيع
العمولة المطلوبة: العمولة التي سيتكبدها تداولك (يمكنك الحصول عليها من نافذة التداول السريع)
فترة المتوسط المتحرك البسيط: فترة رسم المتوسط المتحرك البسيط (الافتراضي = 14)
الحد الأقصى للثواني: الحد الأقصى لعدد الثواني التي سيتم تسجيلها (انظر أدناه)
الخطوط
الرئيسي: خط رسم المؤشر (الافتراضي = أخضر)
المتوسط المتحرك البسيط: خط رسم المتوسط المتحرك البسيط (الافتراضي = أصفر)
الحد الأقصى للثواني
السماح للمؤشر بعرض قيم كبيرة جدًا يعني أن مقياس المؤشر سيمنعك من رؤية التفاصيل عندما يكون وقت التعادل صغيرًا. يتيح لك تعيين هذه المعلمة ضبط الحد الأقصى لمقياس المؤشر. بشكل افتراضي يتم تعيينه على 120 (دقيقتان). لذلك أي ناتج 2 دقيقة أو أكثر سيتم رسمه كـ 120 ثانية.
الدكتور آندي لاركين
حقوق النشر 2025، جميع الحقوق محفوظة
26 مايو 2025
القانوني
يجب التحقق من دقة النتائج من هذا المؤشر قبل استخدامه في التداول المباشر.
لا يتم تقديم أي ضمان أو ضمني لنتائج هذا المؤشر.
لا يتم قبول أي مسؤولية عن أي خسائر ناتجة عن استخدام هذا المؤشر.
الملخص
تقييمات العملاء
5 | 50 % | |
4 | 50 % | |
3 | 0 % | |
2 | 0 % | |
1 | 0 % |


