الوصف
Impulse Matrix Pro 🚀
ما هو؟
https://chartshots.spotware.com/c/69d5282dc32e0
Impulse Matrix Pro هو مؤشر تراكبي يولد إشارات شراء وبيع 📈📉 فقط عندما تتفق ثلاث محركات مستقلة في نفس الوقت. يجمع بين اكتشاف الاتجاه، وكسر الدافع، والمرشحات الذكية في نظام موحد مع مستويات إدارة مخاطر مدمجة 🛡️.
https://chartshots.spotware.com/c/69d5293d873fa
المحركات الثلاثة ⚙️
https://chartshots.spotware.com/c/69d5288a347ea
المحرك 1 — الاتجاه (SMEMA) 🌊
متوسط متحرك مزدوج التنعيم (أسي → ثم بسيط) ينشئ خط Nexus.
- إذا كان يرتفع → الاتجاه صاعد 🟢.
- إذا كان ينخفض → هابط 🔴.
حول هذا الخط، 3 أشرطة مغلفة تُرسم فوق وتحت، تفصلها مسافة تتناسب مع متوسط نطاق الشمعة المملس. تحدد موضع السعر بالنسبة لهذه الأشرطة القوة (0–3):
القوة
المعنى
1/3
السعر يتجاوز الشريط 1
2/3
السعر يتجاوز الشريط 2
3/3
السعر يتجاوز الشريط 3 ⚡
قوة دنيا أعلى = إشارات أقل ولكن ذات جودة أعلى
المحرك 2 — الدافع (BOSWaves)
يكشف عن كسر الهيكل باستخدام أشرطة ديناميكية مبنية من:
- خط أساس EMA
- الانحراف المطلق المتوسط (MAD) كوحدة تقلب
السلوك الرئيسي: تتقلص الأشرطة بعد تحركات قوية (أسهل في التفعيل) وتتوسع أثناء التوحيد (أصعب في التفعيل). يتم التحكم في ذلك بواسطة درجة حداثة الدافع التي تتلاشى مع مرور الوقت ⏳.
- اختراق صاعد: الإغلاق السابق ≤ الشريط العلوي، والإغلاق الحالي يعبر فوقه 🚀.
- اختراق هابط: الإغلاق السابق ≥ الشريط السفلي، والإغلاق الحالي يعبر تحته 📉.
المحرك 3 — المرشحات الذكية 🛡️
ثلاث بوابات يجب أن يمر بها كل إشارة:
- تقلب ATR: السوق به حركة كافية للتداول 🌊
- الزخم: السعر يتحرك فعليًا في اتجاه الإشارة خلال N أشرطة 🏃♂️
- الحداثة: الدافع لم يتلاشى — الحركة لا تزال "حية" 🔥
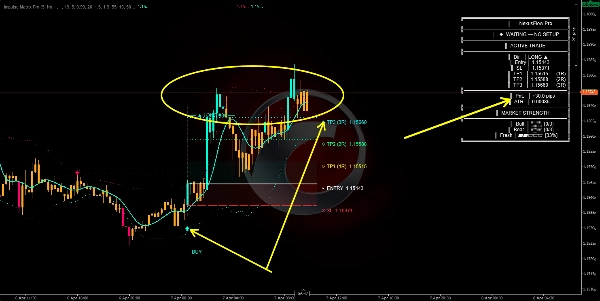
شروط الإشارة 🚦
شراء — يجب أن تكون كل الـ 7 صحيحة: ✅
- خط Nexus يرتفع
- قوة الصعود ≥ الحد الأدنى
- تم الكشف عن اختراق دافع صاعد
- تغير الاتجاه من هابط إلى صاعد
- تم اجتياز فلتر ATR
- الزخم يؤكد الحركة الصاعدة
- حداثة الدافع فوق الحد
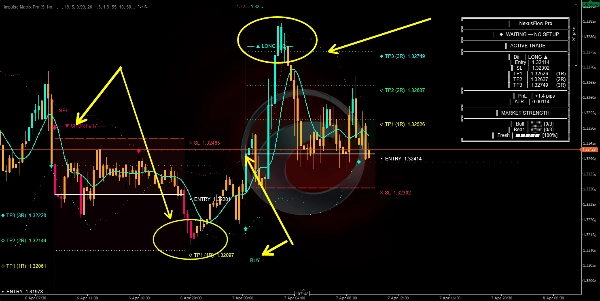
بيع — يجب أن تكون كل الـ 7 صحيحة: ✅
- خط Nexus ينخفض
- قوة الهبوط ≥ الحد الأدنى
- تم الكشف عن اختراق دافع هابط
- تغير الاتجاه من صاعد إلى هابط
- تم اجتياز فلتر ATR
- الزخم يؤكد الحركة الهابطة
- حداثة الدافع فوق الحد
ملاحظة: إذا فشل أي شرط واحد → لا توجد إشارة ❌.
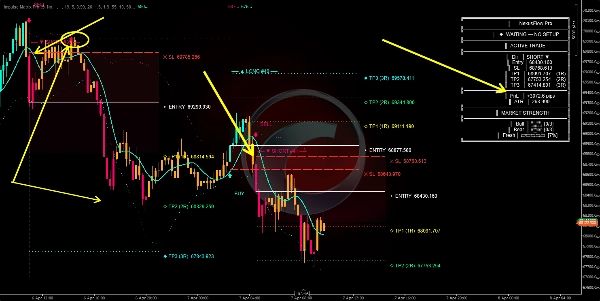
منطق وقف الخسارة وجني الأرباح 📏
جميع المستويات مبنية على ATR وقابلة للتكيف بالكامل مع التقلب الحالي 🔄.
- مسافة وقف الخسارة = ATR × مضاعف وقف الخسارة (الافتراضي 1.5)
المستوى
الحساب
نسبة المخاطرة إلى العائد الافتراضية
وقف الخسارة
الدخول ∓ (ATR × 1.5)
— 🛑
جني الأرباح 1
الدخول ± (مسافة وقف الخسارة × 1.0)
1:1 🎯
جني الأرباح 2
الدخول ± (مسافة وقف الخسارة × 2.0)
1:2 🎯🎯
جني الأرباح 3
الدخول ± (مسافة وقف الخسارة × 3.0)
1:3 💰
الأسواق المتقلبة → وقف خسارة وأهداف أوسع. الأسواق الهادئة → مستويات أضيق. كل شيء يتكيف تلقائيًا ⚖️.
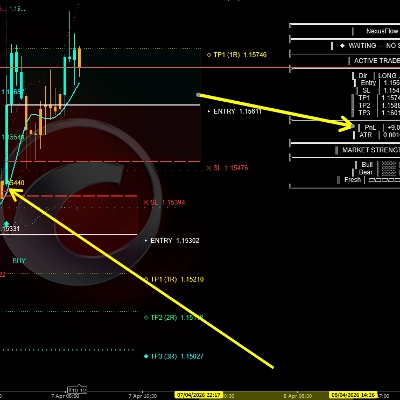
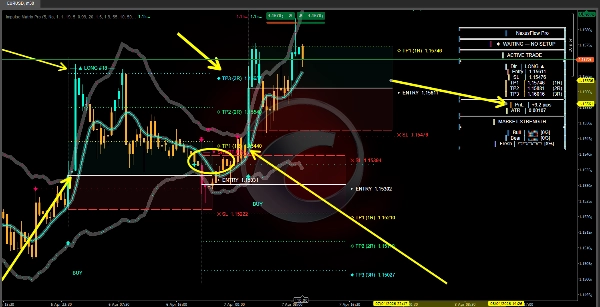
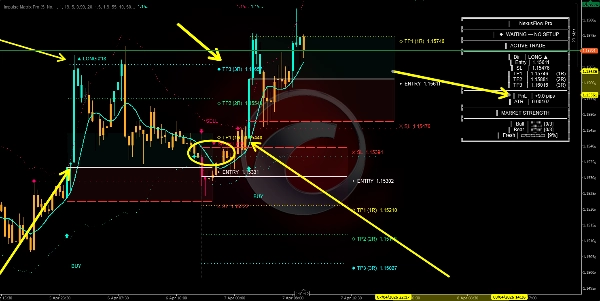
العناصر البصرية 🎨
- خط Nexus: اتجاه الاتجاه المركزي 🧵
- أشرطة المغلف: مناطق قياس القوة مع تعبئة متدرجة 📊
- أشرطة الدافع (منقطة): عتبات كسر ديناميكية 🏁
- أسهم الشراء / البيع: إشارات دخول مؤكدة 🏹
- الماس الأبيض: نقاط انقلاب الاتجاه على خط Nexus 💎
- خطوط الدخول / وقف الخسارة / جني الأرباح: مستويات التداول المتوقعة 📐
- المنطقة الحمراء: منطقة المخاطرة (من الدخول إلى وقف الخسارة) ⚠️
- المنطقة الخضراء / السماوية: منطقة المكافأة (من الدخول إلى جني الأرباح 1) 🏆
- النجوم + الخطوط الأفقية: إشارات إعادة الاختبار — السعر يعاود زيارة شريط الدافع دون كسره ⭐
- سحابة الاتجاه: تظليل خلفي خفيف يظهر الاتجاه السائد ☁️
- ألوان الأعمدة: سماوي = صاعد · وردي = هابط · برتقالي = لا يوجد إعداد 🎨
- لوحة المعلومات (أعلى اليمين): بيانات التداول الحية، الأرباح والخسائر، مقاييس القوة، مقياس الحداثة 🖥️
كيفية الاستخدام 📖
- انتظر سهم شراء/بيع 🏹 — الأعمدة البرتقالية تعني لا يوجد إعداد، ابق خارج التداول 🛑.
- تحقق من اللوحة 🖥️ — قوة وحداثة أعلى = قناعة أعلى.
- تداول المستويات المتوقعة 📏 — وقف الخسارة حيث هو محدد، خذ جزئيات عند TP1/TP2، ودع الباقي يصل إلى TP3.
- أعد اختبار النجوم ⭐ يمكن استخدامها كفرص إضافية لمركز قائم.
- إشارة معاكسة 🔄 = التداول السابق تم إبطاله مفهوميًا.
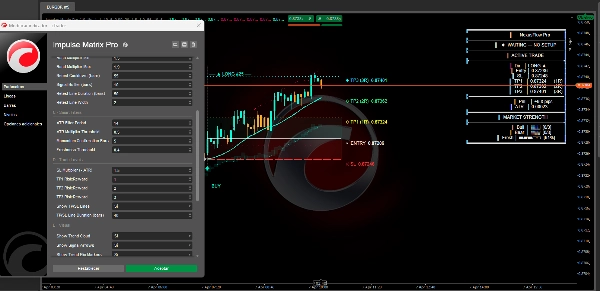
المعلمات الرئيسية ⚙️
المعلمة
قيمة أعلى
قيمة أقل
دورة الفترة
اتجاه أكثر سلاسة، إشارات أبطأ
أسرع، أكثر تفاعلية ⚡
الحد الأدنى للقوة
إشارات أقل، فلتر أكثر صرامة
إشارات أكثر، فلترة أقل 🔍
طول EMA للاتجاه
خط أساس دافع أكثر سلاسة
اختراقات أكثر تفاعلية 🌊
مضاعفات الأشرطة
أشرطة دافع أوسع، كسر أقل
أشرطة أضيق، كسر أكثر 📏
عتبة ATR
يتطلب تقلبًا أقوى 🌪️
يسمح بإشارات منخفضة التقلب
عتبة الحداثة
فقط الدوافع الطازجة مؤهلة 🔥
يسمح بالدوافع المتلاشية
مضاعف وقف الخسارة
وقف خسارة أوسع 🛡️
وقف خسارة أضيق 🎯
نسب جني الأرباح
أهداف أكثر طموحًا 💰
أهداف أكثر تحفظًا
إخلاء المسؤولية ⚠️
هذا المؤشر لا ينفذ الصفقات. هو أداة تحليلية 🧠. مستويات جني الأرباح/وقف الخسارة هي اقتراحات مبنية على التقلبات، وليست ضمانات للسعر. يعمل بشكل أفضل في ظروف الاتجاه 📈. اجمعه مع تحليل هيكل السوق وإدارة المخاطر المناسبة.
الملخص
تقييمات العملاء
5 | 100 % | |
4 | 0 % | |
3 | 0 % | |
2 | 0 % | |
1 | 0 % |


![شعار "[Stellar Strategies] Inside Bar with Signals"](https://cdn.ctrader.com/image/webp/1d9e8bfa-3b2c-4440-bb37-5856902008a7_30683)


