
Descrição
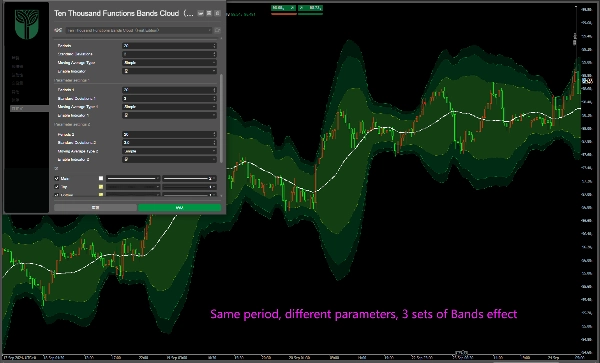
3 grupos regulares de bandas:
período:20
Desvios:2.0;3.0; 3.5;
Com suporte de fundo em nuvem!
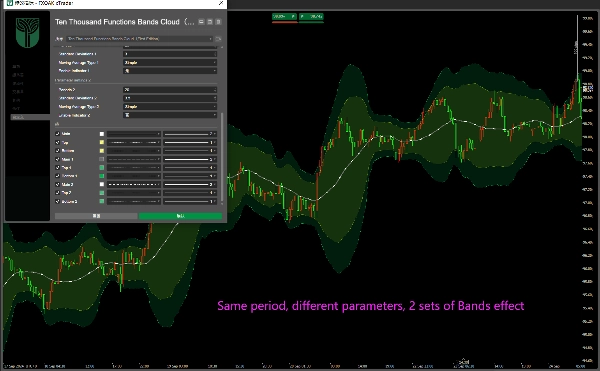
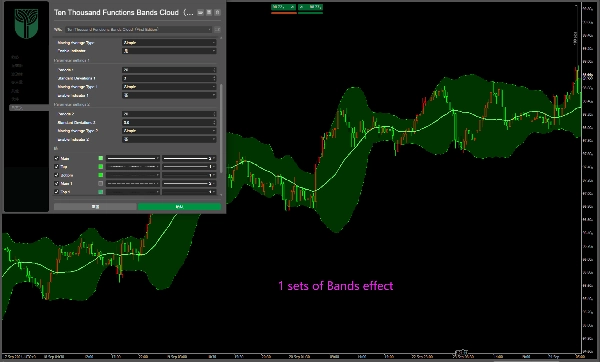
Você pode fechar ou abrir qualquer um ou dois grupos; e diferentes parâmetros podem ser modificados e configurados!
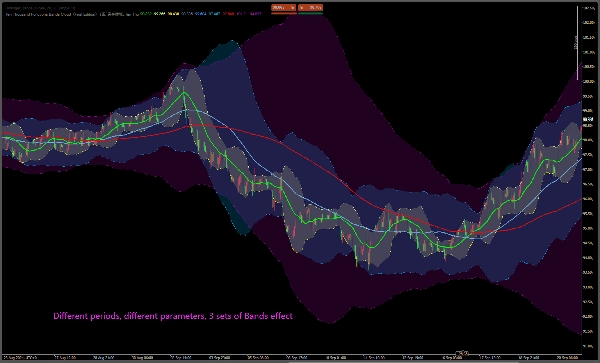
Também pode ser modificado para outros valores, como 2.0:20, 60, 144 bandas;
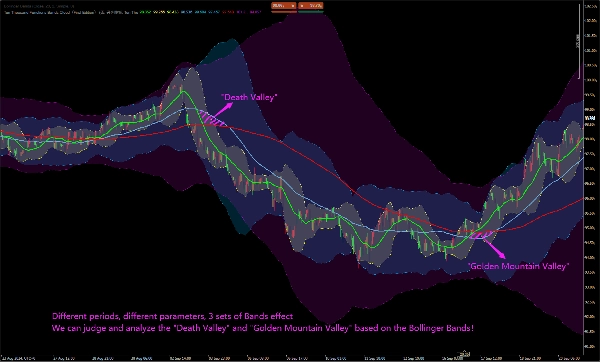
A faixa média das bandas é igual à média móvel, que são as médias móveis de 20, 60 e 144!
Podemos julgar e analisar o "Vale da Morte" e o "Vale da Montanha Dourada" com base na faixa média das Bandas de Bollinger!
3 grupos regulares de Bands:
Período:20
Desvios:2.0;3.0; 3.5;
Suporta fundo em nuvem!
Você pode fechar ou abrir qualquer um ou dois grupos; e pode modificar e configurar diferentes parâmetros!
Também pode ser modificado para outros valores, como 2.0:20, 60, 144 bandas de Bollinger;
A faixa média das Bands é igual à média móvel, ou seja, as médias móveis de 20, 60 e 144!
Podemos julgar e analisar o "Vale da Morte" e o "Vale da Montanha Dourada" com base na faixa média das Bands......
標準3グループボリンジャーバンド(Bands):期間:20;偏差値:2.0;3.0;3.5;クラウドバックグラウンドに対応!任意の1グループまたは2グループをオン/オフ設定することが可能です。また、各パラメーターの修正と設定も行えます。他の数値に変更することも可能です。例えば2.0の偏差値で、期間20、60、144のボリンジャーバンドに設定するなど。ボリンジャーバンドの中線は移動平均線に等しく、すなわち期間20、60、144の移動平均線です。ボリンジャーバンドの中線に基づいて、「デッドバレー(死亡谷)」や「ゴールドバレー(金山谷)」などを判断・分析することができます。
Стандартные 3 группы Бандов (Полос Боллинджера): Период: 20; Отклонение: 2,0; 3,0; 3,5; Поддержка облачного фона! Вы можете отключить или включить любую одну или две группы; кроме того, вы можете изменять и настраивать различные параметры! Его также можно изменить на другие значения, например, Боллинджеры с отклонением 2,0 и периодами 20, 60, 144; Средняя линия Бандов равна скользящей средней, то есть скользящим средним с периодами 20, 60 и 144! Мы можем определять и анализировать такие явления, как «Мёртвая долина» и «Золотая долина», на основе средней линии 。
Resumo
Avaliações de clientes
5 | 100 % | |
4 | 0 % | |
3 | 0 % | |
2 | 0 % | |
1 | 0 % |


