
Mô tả
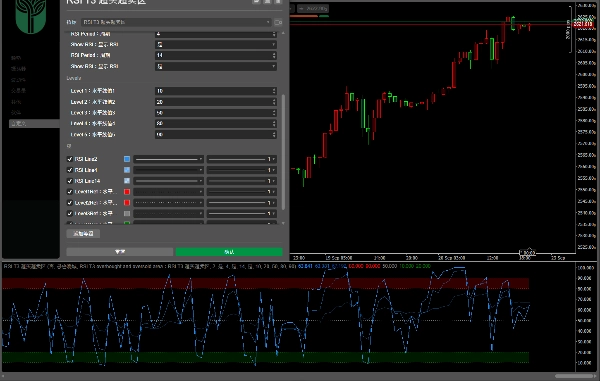
RSI Ba Tham Số với Vùng Quá Mua/Quá Bán
(Các tham số và vùng quá mua/quá bán có thể điều chỉnh độc lập; mỗi đường chu kỳ có thể bật hoặc tắt riêng biệt), giúp quan sát cộng hưởng đa chu kỳ:
• Tính Nhất Quán Xu Hướng:
RSI chu kỳ ngắn, trung và dài di chuyển cùng chiều. Nếu RSI chu kỳ ngắn duy trì trên RSI chu kỳ trung và dài, điều đó cho thấy xu hướng tăng; ngược lại, cho thấy xu hướng giảm.
• Phân Kỳ và Đảo Chiều:
Khi giá đạt đỉnh/đáy mới nhưng RSI chu kỳ ngắn không theo kịp, và RSI chu kỳ trung và dài suy yếu/hồi phục, đó là tín hiệu có thể điều chỉnh/điều chỉnh tăng.
• Xác Nhận Quá Mua/Quá Bán:
Khi RSI một chu kỳ vào vùng quá mua hoặc quá bán, cần kết hợp đánh giá với các chu kỳ khác; nếu nhiều chu kỳ cùng lúc vào vùng quá mua hoặc quá bán, tín hiệu sẽ đáng tin cậy hơn.
• Cộng Hưởng Chu Kỳ:
Khi RSI nhiều chu kỳ gửi cùng một tín hiệu (ví dụ, tất cả đều vượt qua đường giữa 50), khả năng xu hướng tiếp tục hoặc đảo chiều cao hơn, có thể hỗ trợ trong việc ra quyết định.
带超买超卖区域的三参数 RSI
(可自主调整参数与超买超卖区域,支持单独开关各周期线),便于观察多周期共振:
•趋势一致性:
短、中、长周期 RSI 同向运行,短周期在中长周期上方为多头趋势;反之则为空头趋势。
•背离与反转:
价格创新高 / 低但短周期 RSI 未同步,且中长周期 RSI 走弱 / 回升,提示可能回调 / 反弹。
•超买超卖确认:
单周期超买超卖时,需结合其他周期判断;多周期同时超买超卖,信号更可靠。
•周期共振:
多周期 RSI 同发信号(如均突破 50 中轴线),趋势延续或反转的概率更高,可辅助决策。
Tóm tắt
- Trend Consistency: Identifies bullish or bearish trends based on the relative positions of short-, medium-, and long-cycle RSIs.
- Divergence and Reversal Signals: Detects potential pullbacks or rallies when price movements diverge from short-cycle RSI behavior while medium- and long-cycle RSIs weaken or recover.
- Overbought/Oversold Confirmation: Enhances signal reliability by combining overbought or oversold conditions across multiple RSI cycles.
- Cycle Resonance: Highlights stronger trend continuation or reversal probabilities when multiple RSI cycles simultaneously signal, such as crossing the 50 midline.
This indicator supports detailed momentum analysis by integrating multi-timeframe RSI data, aiding traders in decision-making through comprehensive trend and reversal insights.
Đánh giá của khách hàng
5 | 0 % | |
4 | 100 % | |
3 | 0 % | |
2 | 0 % | |
1 | 0 % |


