
Описание
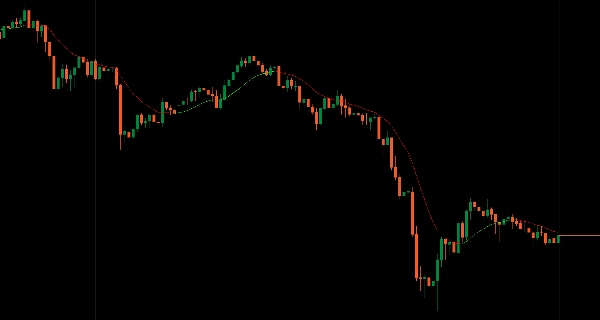
Адаптивный анализ тренда с использованием математики регрессии с ядровыми весами.
Применяет гауссово ядровое взвешивание, при котором ближайшие бары влияют сильнее, а дальние бары затухают экспоненциально, создавая ультра-гладкие линии тренда без задержки с фиксированным периодом.
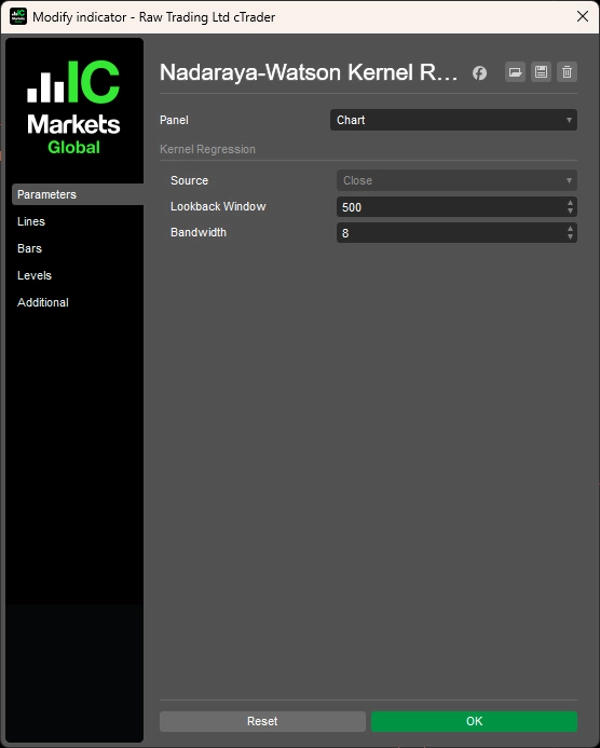
Автоматическая настройка под локальную структуру цены, минимальная задержка по сравнению с традиционными скользящими средними, динамическое цветовое кодирование (лаймовый — восходящий тренд, красный — нисходящий тренд), регулируемая ширина полосы для настройки отзывчивости, гибкое окно обратного просмотра (50-2000 баров) и двухцветный дизайн без шума обеспечивают математически точное определение тренда для трейдеров, ищущих адаптивное сглаживание без произвольного выбора периода.
ОСОБЕННОСТИ
Вычисление с ядровыми весами
- Ближайшие бары влияют сильнее, дальние бары затухают экспоненциально — без произвольных фиксированных периодов
- Гауссово ядровое взвешивание для математически оптимального сглаживания
- Автоматическая подстройка под локальную структуру цены без ручной перенастройки
- Минимальная задержка: реагирует быстрее на реальные изменения тренда, чем эквивалентные скользящие средние
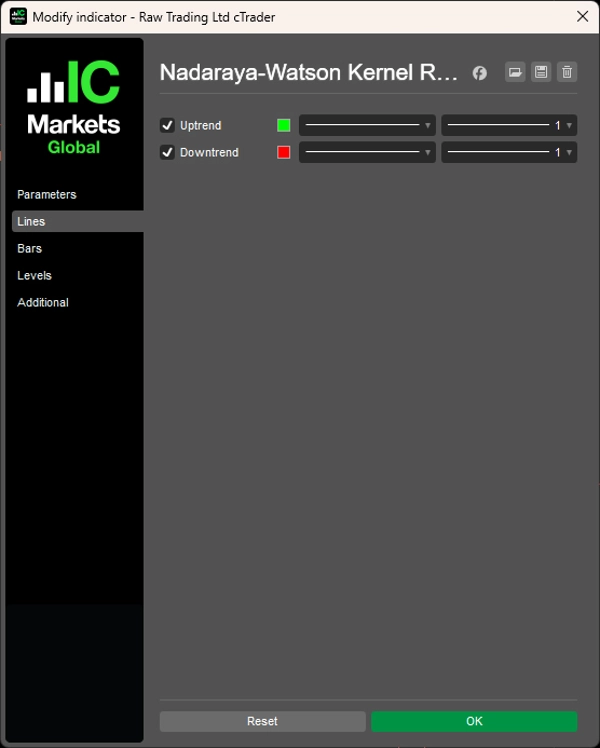
Динамическое цветовое кодирование
- Лаймовый: восходящий тренд
- Красный: нисходящий тренд
- Мгновенное визуальное подтверждение направления тренда
- Прерывистое отображение линии: изменения цвета мгновенны и визуально четки
Регулируемые параметры
- Ширина полосы: тонкая настройка отзывчивости против сглаживания
- Гибкое окно обратного просмотра: 50-2000 баров для соответствия вашему таймфрейму
- Адаптация к различным рыночным условиям и стилям торговли
Чистый дизайн
- Два цвета, никакой загроможденности — либо восходящий, либо нисходящий тренд
- Определение тренда без шума
- Без сложных настроек
- Визуальная простота с математической точностью
__________________________________________________________________________________________
БОЛЬШЕ БЕСПЛАТНЫХ ИНДИКАТОРОВ
Изучите широкий спектр инструментов анализа рынка — от структуры и объема до регрессии, волатильности и пользовательских таймфреймов.
Исходный код доступен в репозитории на GitHub repository.
Все бесплатно для использования. Но если хотите поддержать кофе, можете отправить поддержку здесь.
Поддержка/Сопротивление
Объем
- Volume Activity Profiler
- Volume Efficiency Analyzer
- Volume Profile Analytics
- Volume Profile - Updated
- Volume Spread Analysis
- VWAP (Volume Weighted Average Price)
Скользящие средние
- SSL Channel
- Anchored Moving Average
- Deviation-Scaled Moving Average
- Gann High Low Activator
- Instantaneous Trendline
- Kaufman Adaptive MA with Trend Vision
- Moving Average Channel
- Moving Averages Suite
- Trend Channel Moving Average
Утилиты/Пользовательские
Регрессия
Волатильность
Осцилляторы
__________________________________________________________________________________________
ОТКАЗ ОТ ОТВЕТСТВЕННОСТИ
Торговля связана с риском. Этот индикатор предназначен только для технического анализа — всегда применяйте надлежащее управление рисками и торгуйте ответственно.
ОБРАТНАЯ СВЯЗЬ И УЛУЧШЕНИЯ
Если у вас есть предложения, запросы функций или идеи для улучшения, пожалуйста, оставьте комментарий на вкладке Обсуждение. Ваш отзыв помогает улучшить индикатор для всех.
Сводка
Key features include dynamic color coding with lime indicating uptrends and red indicating downtrends, offering instant visual confirmation of trend direction through a noise-free, two-color design. Users can fine-tune the indicator’s responsiveness and smoothness via adjustable bandwidth and select a flexible lookback window ranging from 50 to 2000 bars to suit various timeframes and market conditions.
The indicator emphasizes mathematical precision and visual simplicity, requiring no complex settings. It is designed for traders seeking an adaptive smoothing method for trend identification without arbitrary period selection. This tool supports scalping strategies and is part of a broader suite of market analysis indicators focused on regression, volume, volatility, and custom timeframes.
Отзывы покупателей
5 | 100 % | |
4 | 0 % | |
3 | 0 % | |
2 | 0 % | |
1 | 0 % |


