
SMA_Cross_Signal
مؤشر
111 التنزيلات
الإصدار 1.0، Jan 2026
Windows, Mac
الوصف
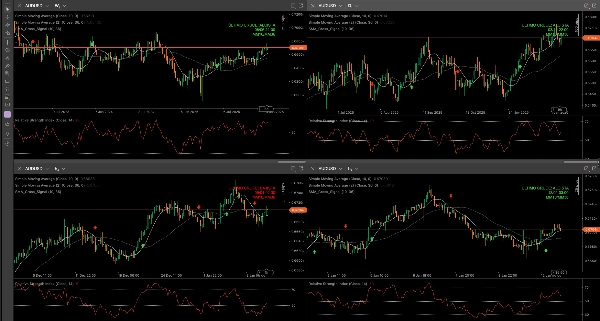
مؤشر نظيف وبسيط ومرئي للغاية يكتشف تقاطعات بين متوسطين متحركين بسيطين (SMA) ويعرض كل شيء بوضوح على الرسم البياني.
الميزات الرئيسية:
- سهام ملونة كبيرة عند نقطة التقاطع الدقيقة → أخضر ليموني ↑ → تقاطع صعودي (شراء محتمل) → أحمر ↓ → تقاطع هبوطي (بيع محتمل)
- لوحة حالة دائمة في الزاوية العلوية اليمنى من الرسم البياني → نوع آخر تقاطع (صعودي / هبوطي / انتظار) → التاريخ والوقت الدقيق للتقاطع → الفترات المضبوطة للمتوسطات المتحركة
- 100% غير معيد للرسم
- يمنع الإشارات المكررة على نفس الشمعة
- يطبع رسائل في السجل في كل مرة يحدث فيها تقاطع (مفيد جدًا للتتبع)
- خفيف جدًا – يعمل بشكل مثالي على أي إطار زمني
طريقتي المفضلة لاستخدامه (والتي أوصي بها):
أطبقه في نفس الوقت على الأسبوعي، اليومي، H4، و H1 للأزواج ذاتها.
أخذ مداخلاتي بشكل رئيسي على H1، لكن وجود المؤشر على الأطر الزمنية الأعلى يعطيني رؤية شاملة قوية جدًا لاتجاه الزوج السائد:
- هل التقاطعات الصعودية/الهبوطية متوافقة عبر الأسبوعي واليومي؟ → احتمال أعلى
- إشارات متضاربة بين الأطر الزمنية؟ → من الأفضل الانتظار أو تقليل حجم المركز
الإعدادات الشائعة التي تعمل جيدًا:
- 9 / 21
- 10 / 30
- 21 / 50
- 50 / 200 (مفيد بشكل خاص على الرسوم الأسبوعية واليومية)
مثالي للمبتدئين (بفضل وضوحه وبساطته) والمتداولين ذوي الخبرة الذين يبحثون عن قاعدة نظيفة للدمج مع حركة السعر، الدعم/المقاومة، أو الحجم.
مجاني تمامًا لجميع مجتمع cTrader!
جربه على الحساب التجريبي، طبقه في وضع الأطر الزمنية المتعددة، وإذا أعجبك… لا تتردد في ترك تعليق مع إعداداتك المفضلة أو الزوج الذي يعمل معه بشكل أفضل بالنسبة لك 😊
تداول سعيد للجميع!
الملخص
ملخص الذكاء الاصطناعي
SMA Cross Signal is a visual trading indicator that identifies crossovers between two Simple Moving Averages (SMAs) on a chart. It marks bullish crossovers with lime green upward arrows and bearish crossovers with red downward arrows at the exact crossover points. A permanent status panel in the chart’s top-right corner displays the latest crossover type (Bullish, Bearish, or Waiting), the exact date and time of the crossover, and the configured SMA periods.
Key features include non-repainting signals, prevention of duplicate alerts on the same bar, and log messages for each crossover event. The indicator is lightweight and compatible with any timeframe, making it suitable for multi-timeframe analysis. Commonly used SMA period pairs include 9/21, 10/30, 21/50, and 50/200, with the latter especially useful on weekly and daily charts.
Traders often apply the indicator simultaneously on weekly, daily, 4-hour, and 1-hour timeframes to gain a comprehensive view of market direction and improve entry timing. It supports various markets including Forex and popular symbols like EURUSD, GBPUSD, USDJPY, XAUUSD, and BTCUSD. The indicator is designed for both beginners and experienced traders seeking clear, straightforward moving average crossover signals.
ملف تعريف المؤشر
تقييمات العملاء
0.0
التقييمات: 0
تقييمات العملاء
لا توجد تقييمات لهذا المنتج حتى الآن. هل جرَّبته بالفعل؟ كن أول من يخبر الآخرين!
مناقشة
الأسئلة الشائعة
BTCUSD
Forex
Signal
EURUSD
GBPUSD
XAUUSD
USDJPY
يتم توفير المنتجات المتاحة من خلال cTrader Store، بما في ذلك روبوتات التداول والمؤشرات والإضافات، من قبل مطوري الطرف الثالث وإتاحتها لأغراض الوصول المعلوماتي والفني فقط. cTrader Store ليس وسيطًا ولا يقدم نصائح استثمارية أو توصيات شخصية أو أي ضمان للأداء المستقبلي.


السعر
منذ 10/03/2025
111
التثبيتات المجانية