

الوصف
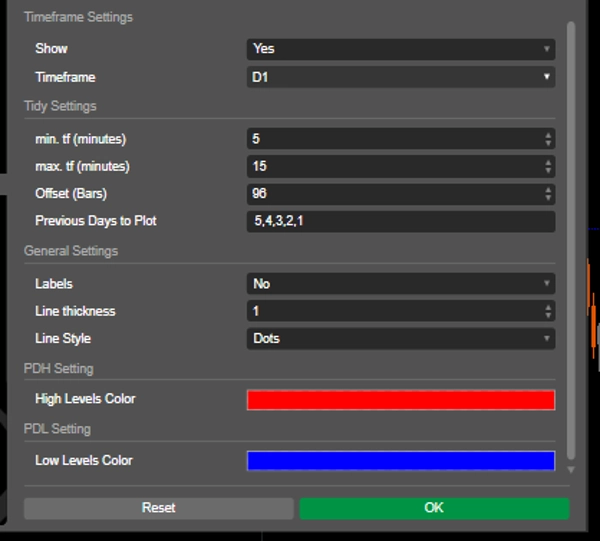
تتيح هذه الأداة للمستخدمين تحديد إطار زمني للتحليل، مثل اليومي، ورسم مستويات الأعلى والأدنى على مخططاتهم بألوان وأنماط وسماكات قابلة للتخصيص. تدعم عدة أيام سابقة، مما يسهل تحديد مناطق حركة السعر المهمة. كما يتميز المؤشر بعلامات اختيارية للوضوح، مما يساعد المتداولين على اتخاذ قرارات مستنيرة بناءً على بيانات السعر التاريخية. مثالية لكل من المتداولين المبتدئين وذوي الخبرة، تعزز هذه الأداة تحليل السوق واستراتيجيات التداول.
الميزات
إطار زمني قابل للتخصيص: يمكن للمستخدمين اختيار إطار زمني محدد (مثل اليومي) لتحليل أعلى وأدنى المستويات السابقة، مما يسمح بتصور مخصص يتناسب مع استراتيجيات التداول الخاصة بهم.
عدة أيام سابقة: توفر القدرة على رسم مستويات الأعلى والأدنى لعدة أيام سابقة رؤية شاملة لمناطق حركة السعر المهمة.
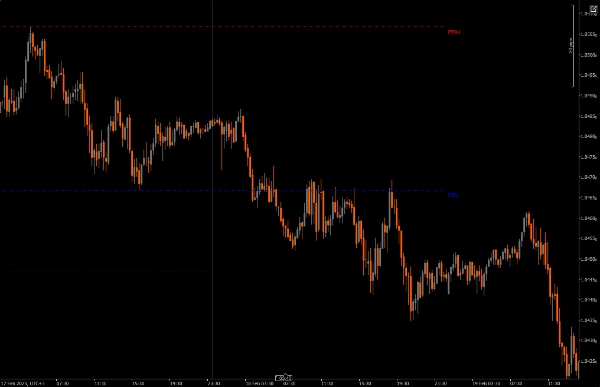
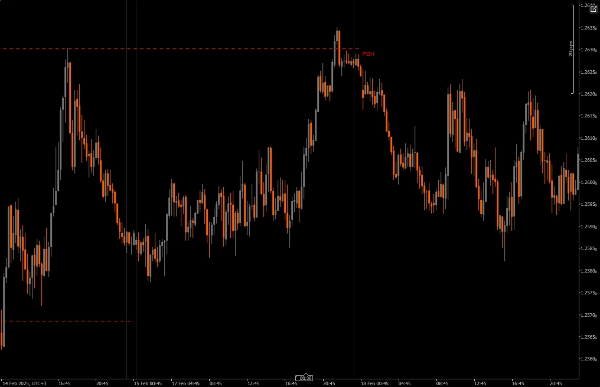
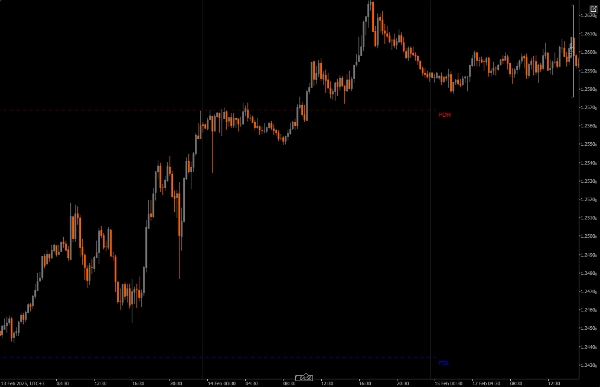
خطوط الاتجاه الديناميكية: يرسم المؤشر خطوط اتجاه لأعلى وأدنى اليوم السابق، مما يسهل التعرف على مناطق الانعكاس المحتملة بنظرة سريعة.
خيارات التسمية: يمكن للمستخدمين تفعيل العلامات لعرض قيم الأعلى والأدنى الحالية مباشرة على المخطط، مما يعزز الوضوح والفهم.
التخصيص البصري: يمكن للمتداولين تخصيص ألوان الخطوط وأنماطها وسماكاتها لتناسب تفضيلاتهم وتحسين قابلية قراءة المخطط.
قيود الإطار الزمني: يضمن المؤشر عمله فقط ضمن إعدادات الإطار الزمني الأدنى والأقصى المحددة، مما يقلل من ازدحام المخطط أثناء التنقل بين الأطر الزمنية الأخرى.
نقاط يجب ملاحظتها
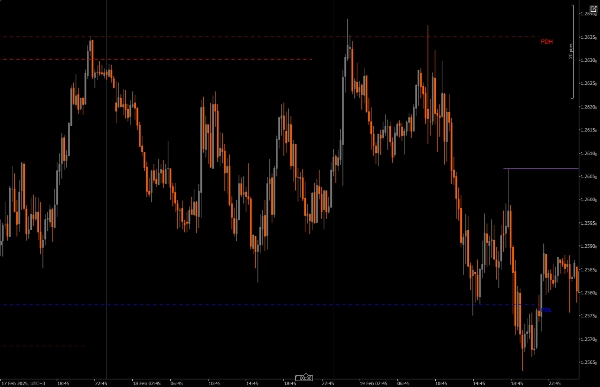
يمكن استخدام PDH أو PDL في السوق كأداة للرسم على السيولة (DOL) أو لاستخدامها في تأطير الانعكاس.
يمكن تأطير الانعكاسات من PDH و PDL عندما يكون هناك فشل في الإزاحة.
عندما يحترم السعر مجموعة PD أعلاه أو أدناه، ويفشل في الإزاحة فوق مستوى أعلى أو أدنى يومي، يمكن توقع الشمعة التالية.
هل من المرجح أن يصل السعر إلى أعلى أو أدنى اليوم السابق؟ عند استخدام PDH PDL كأداة للرسم على السيولة (DOL)
التثبيت: قم بتنزيل وتثبيت Daily Range Liquidity Zones (PDH PDL) على منصة cAlgo الخاصة بك.
الإعداد: افتح إعدادات المؤشر واختر الإطار الزمني المرغوب للتحليل، وعدد الأيام السابقة للرسم، وقم بتخصيص المعلمات البصرية مثل لون الخط وسماكته.
استخدام المؤشر: سيقوم المؤشر تلقائيًا برسم مستويات الأعلى والأدنى لليوم السابق على مخططك بناءً على الإعدادات المحددة.
التحليل: راقب المستويات المرسومة أثناء التداول. استخدم هذه المستويات لتأطير الانعكاسات المحتملة، واتخاذ قرارات تداول مستنيرة.
الأدوات المساعدة الموصى بها
cTrader: المنصة الأصلية لـ cAlgo، توفر بيئة سلسة لاستخدام وتخصيص المؤشرات.
أدوات التحليل الفني: اجمع هذا المؤشر مع أدوات أخرى مثل Fair Value Gaps (FVG) ومؤشرات نمط الانعكاس (CRT) لتعزيز استراتيجية التداول وتحليل السوق.
أدوات إدارة المخاطر: استخدم حاسبات حجم المركز وأدوات وقف الخسارة لإدارة المخاطر بفعالية أثناء التداول حول المستويات الأعلى والأدنى المحددة.
من خلال دمج Daily Range Liquidity Zones (PDH PDL) مع هذه الأدوات، يمكن للمتداولين تعزيز تحليل السوق وتحسين فرص نجاحهم في التنقل عبر تعقيدات حركة السعر.
الملخص
تقييمات العملاء
5 | 100 % | |
4 | 0 % | |
3 | 0 % | |
2 | 0 % | |
1 | 0 % |


![شعار "[Hamster-Coder] Moving Average MTF"](https://cdn.ctrader.com/image/webp/b11b98b1-194d-4b8e-b00e-d611826ad159_31226)
