


Opis
MARCs Market Overview Lite XAUUSD to darmowy, ograniczony wskaźnik przeglądu rynku dla cTrader.
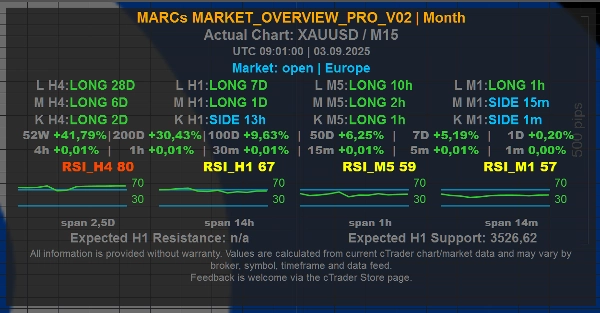
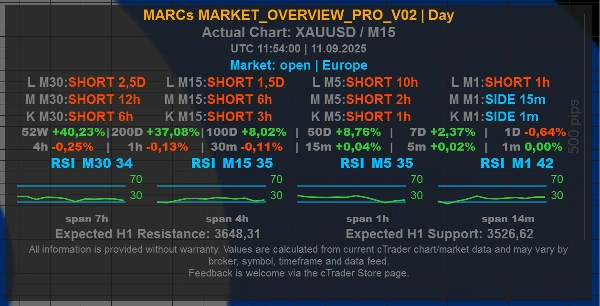
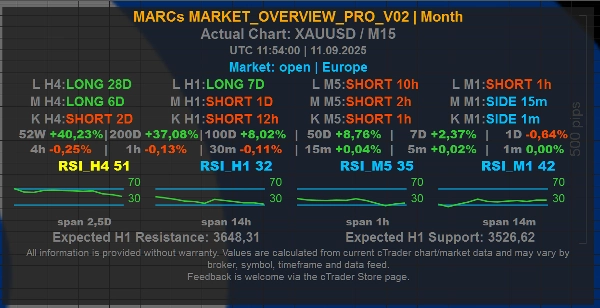
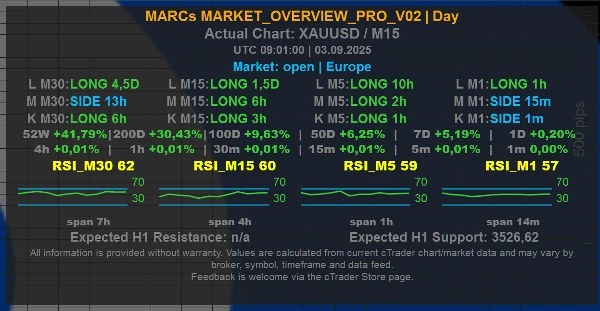
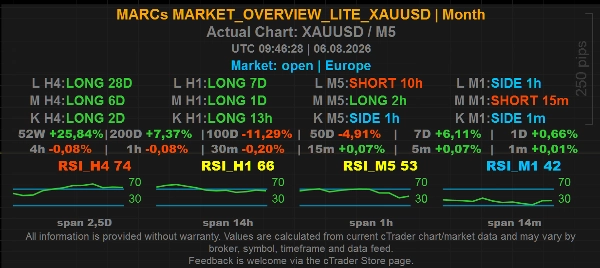
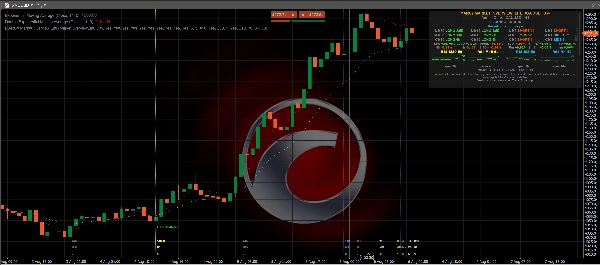
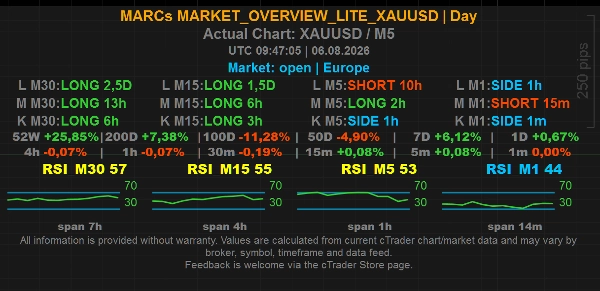
Wyświetla kompaktowy panel na wykresie dla wykresów XAUUSD / Złoto z kontekstem trendu wieloczasowego, odczytami RSI, informacjami o rynku/sesji, opcjonalnymi wartościami na poziomie wykresu oraz uproszczonym zestawem kontrolek wyświetlania.
Ta edycja Lite została zaprojektowana jako skoncentrowane narzędzie przeglądu XAUUSD. Zachowuje podstawowy przepływ pracy panelu MARCs Market Overview, używając stałych ustawień wewnętrznych i ograniczonego wyboru presetów.
Główne cechy:
- Darmowa edycja Lite dla wykresów XAUUSD
- Kompaktowy panel przeglądu rynku na wykresie
- Wiersze trendu wieloczasowego dla krótkiego, średniego i długiego kontekstu rynku
- Wartości RSI i mini historia RSI w stałych wewnętrznych ramach czasowych
- Linia rynku/sesji z czasem UTC
- Presety horyzontu czasowego Dzień i Miesiąc
- Opcjonalna linia rynku
- Opcjonalne wartości na poziomie wykresu H1 wyświetlane bezpośrednio w panelu
- Opcjonalne uproszczone linie poziomu H1 na wykresie
- Opcjonalne etykiety linii, markery pochodzenia poziomu i markery cofania
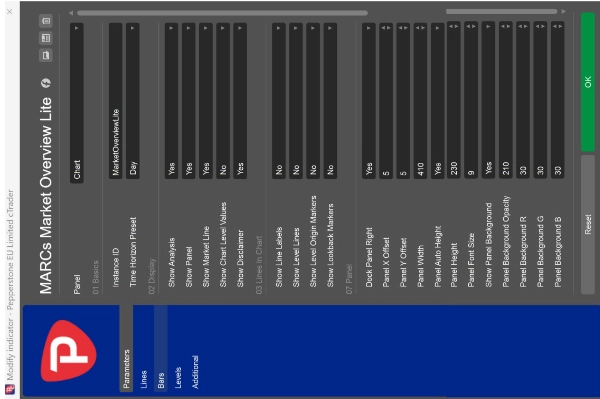
- W pełni regulowana pozycja panelu, szerokość, wysokość, rozmiar czcionki i wygląd tła
Ograniczenia edycji Lite:
- Działa tylko na wykresach XAUUSD
- Preset horyzontu czasowego ograniczony do Dnia i Miesiąca
- Wiersze trendu używają stałych wewnętrznych ustawień ram czasowych i świec
- Wyświetlanie RSI używa stałych wewnętrznych ustawień
- Wyświetlanie czasu używa stałych wewnętrznych ustawień
- Wartości na poziomie wykresu ograniczone do H1
- Linie poziomu wykresu dostępne jako uproszczona opcja włącz/wyłącz i używają stałych poziomów H1
- Niektóre zaawansowane opcje dostosowywania z wersji Pro nie są uwzględnione
Jeśli wskaźnik jest przypięty do innego symbolu, panel wyświetla wyraźne powiadomienie tylko dla XAUUSD zamiast pokazywać wartości przeglądu.
Linie poziomu i wartości na poziomie wykresu:
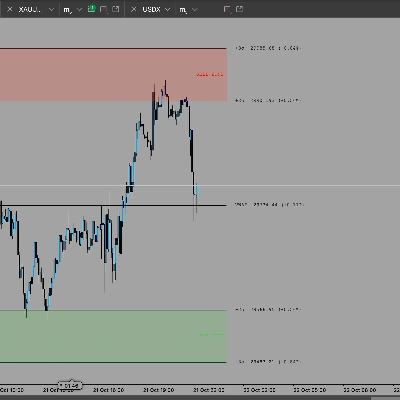
Opcjonalne ustawienie Pokaż Linie Poziomu może wyświetlać obliczone poziomy odniesienia wykresu H1. W edycji Lite jest to uproszczone do opcji włącz/wyłącz. Po włączeniu wskaźnik pokazuje najbliższy obliczony opór powyżej bieżącej ceny oraz najbliższe obliczone wsparcie poniżej bieżącej ceny.
Opcjonalne ustawienie Pokaż Wartości Poziomu Wykresu może pokazać te same najbliższe wartości odniesienia oporu/wsparcia H1 bezpośrednio w panelu bez rysowania linii na wykresie. Linia panelu jest oznaczona, na przykład, "Poziomy Wykresu H1 | R ... | S ...", aby jasno wskazać, że wartości odnoszą się do odniesień na poziomie wykresu.
Jak obliczane są Linie Poziomu:
Poziomy pochodzą z przeszłych lokalnych maksimów i minimów w wybranym wewnętrznym przedziale czasowym. Bliskie punkty zwrotne są grupowane w klastry poziomów, a pokazywane są tylko obszary z wystarczającą liczbą powtórzonych dotknięć. Sprawia to, że linie są wizualnymi markerami kontekstu rynkowego opartymi na dostępnej historii wykresu.
Czego Linie Poziomu nie oznaczają:
Linie Poziomu nie są sygnałami kupna, sygnałami sprzedaży, rekomendacjami stop-loss, rekomendacjami take-profit ani poradami inwestycyjnymi. Nie przewidują, że cena odwróci się, wybije lub zareaguje na określonym poziomie.
O wersji Pro:
MARCs Market Overview Pro oferuje szersze zastosowanie symboli, więcej presetów horyzontu czasowego oraz bardziej szczegółowe opcje dostosowywania. Edycja Lite XAUUSD to darmowa, skoncentrowana wersja dla traderów, którzy chcą prostszego panelu przeglądu rynku Złota/XAUUSD.
Ważne:
MARCs Market Overview Lite XAUUSD to narzędzie przeglądu rynku służące wyłącznie do analizy. Nie wykonuje transakcji, nie zarządza pozycjami, nie udziela porad inwestycyjnych ani nie gwarantuje wyników handlowych.
Wszystkie odczyty zależą od dostępnych danych wykresu cTrader, feedu symbolu brokera, ram czasowych i historii rynku. Wartości mogą się różnić między brokerami, symbolami i źródłami danych.
Trading wiąże się z ryzykiem. Wyniki z przeszłości nie gwarantują przyszłych rezultatów.
NOTA TRANSPARENTNOŚCI
Ten wskaźnik został opracowany przy pomocy narzędzi opartych na sztucznej inteligencji.
Podsumowanie
Level lines are calculated from past swing highs and lows on the H1 timeframe, highlighting key resistance and support clusters based on repeated price touches. These lines serve as visual market context markers but do not constitute trading signals or advice.
The panel’s position, size, font, and background appearance are fully adjustable. The Lite edition uses fixed internal settings and limited presets, restricting its use to XAUUSD charts only. It does not place trades or provide investment recommendations. This tool relies on available chart data and broker feeds, which may vary.
This edition offers a streamlined overview for Gold traders, with broader symbol support and customization available in the Pro version.
Dyskusja
Opinie klientów
5 | 0 % | |
4 | 100 % | |
3 | 0 % | |
2 | 0 % | |
1 | 0 % |
Częste pytania











Cena