
الوصف
هل سئمت من قضاء وقت طويل في وضع علامات على مخططاتك؟ هذا المؤشر يقوم بذلك بسرعة فائقة من أجلك.
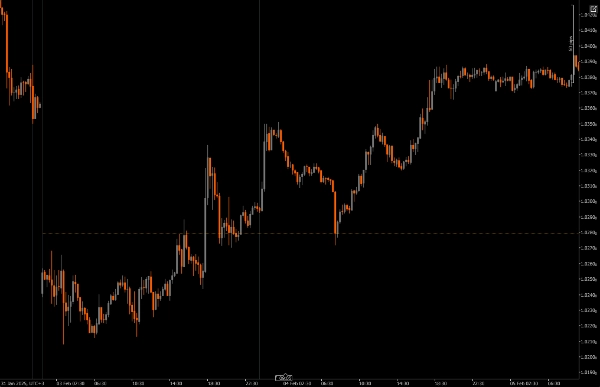
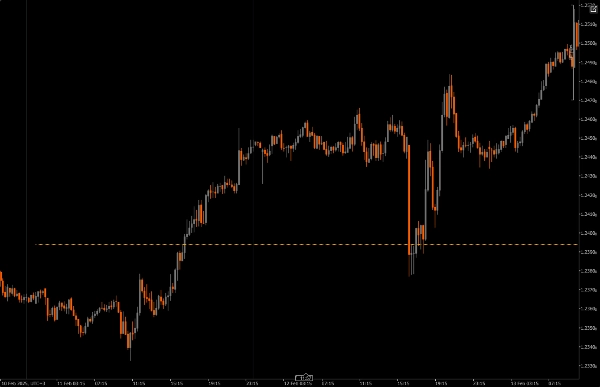
يجد النقطة الوسطى بين أعلى وأدنى سعر لليوم السابق، ويرسمها على مخططاتك. الآن يمكنك فحص مخططاتك بسرعة كبيرة. سهل جدًا!
بعض الميزات الرائعة
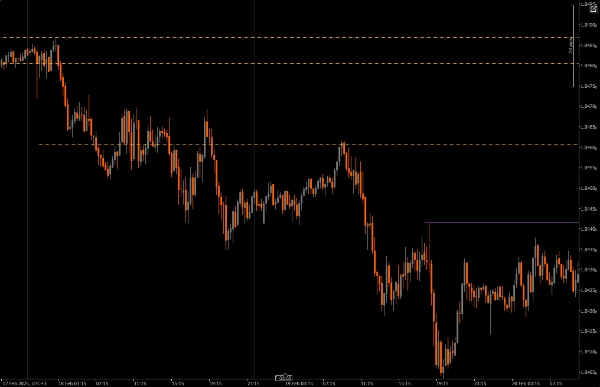
إطار زمني مرجعي قابل للتخصيص: يمكنك اختيار إطار زمني أدنى وأعلى لرسم مستويات السعر المهمة، مما يساعد في مواءمة تداولاتك اليومية مع الاتجاهات السوقية الأوسع.
ما يجعل هذا المؤشر مميزًا هو القدرة على متابعة الشمعة الأسبوعية أثناء طباعتها يومًا بيوم، مما يسهل التقاط توسع الشمعة الأسبوعية.
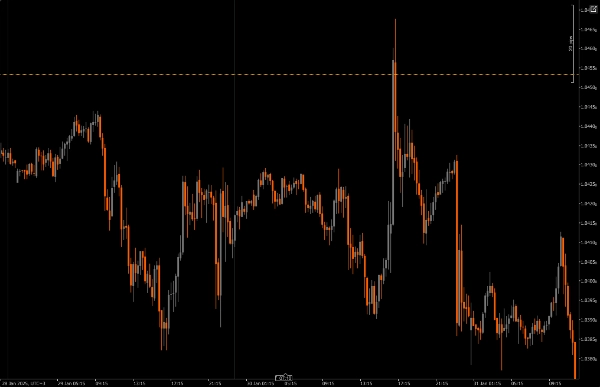
معامل الإزاحة: تتيح لك هذه الميزة تحديد مدى امتداد المستويات المرسومة إلى المستقبل، مما يمنحك صورة أوضح لمناطق استمرار السعر المحتملة.
التخصيص البصري: لديك العديد من الخيارات لتعديل أنماط الخطوط وسمكها وألوانها، مما يسهل إنشاء مخطط يناسب أسلوبك الشخصي وسهل القراءة.
قيود الإطار الزمني: يتضمن المؤشر فحوصات لضمان عمله فقط ضمن إعدادات الإطار الزمني التي تحددها، حتى تتجنب ازدحام المخطط أثناء التنقل بين أطر زمنية أخرى.
نقاط يجب ملاحظتها:
مفضل شخصي
هل أنت مثلي ولا تستطيع الابتعاد عن وضع علامات على مخططاتك؟ جرب هذا المؤشر. يحتوي على قيود إطار زمني ووظيفة فترة الرجوع تهدف إلى تقليل ازدحام المخطط.
هذا المؤشر مفيد في متابعة كيفية تطور الشمعة الأسبوعية؛ إذا أظهر توسع الأسبوع علامات تدفق طلب صاعد، فإن مستويات المحور في هذا المؤشر تصور المناطق أو المناطق للانضمام إلى التوسع الصاعد، وبالمثل، إذا أظهر توسع الأسبوع تدفق طلب هابط، فإن مستويات المحور في هذا المؤشر تصور المناطق أو المناطق للانضمام إلى التوسع الهابط.
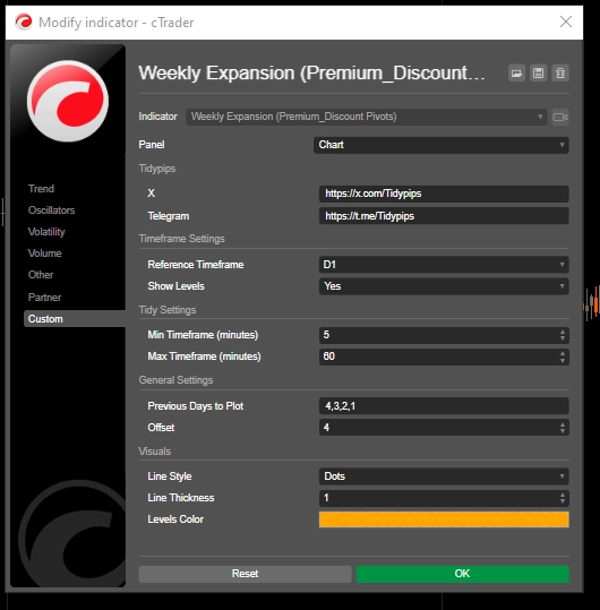
التثبيت: ابدأ بتنزيل وتثبيت Previous Day Equilibrium على منصة cAlgo الخاصة بك.
الإعداد: افتح الإعدادات لاختيار إطارك الزمني المرجعي، واختر عدد الأيام السابقة التي تريد رسمها، وقم بتخصيص الإعدادات البصرية حسب رغبتك.
التحليل: أثناء التداول، راقب المستويات المرسومة على مخططك. تشير هذه المستويات إلى الأماكن التي قد ينقلب فيها السعر بناءً على حركة السعر التاريخية، مما يساعدك على اتخاذ قرارات أكثر وعيًا.
التنفيذ: استخدم هذه المستويات لتحديد نقاط الدخول والخروج، بالإضافة إلى أوامر وقف الخسارة وجني الأرباح، ودمجها في استراتيجيتك التداولية الشاملة.
الأدوات المساعدة الموصى بها:
cTrader: هذه هي أفضل منصة لاستخدام Previous Day Equilibrium، حيث توفر تجربة سلسة للتخصيص والتحليل.
أدوات التحليل الفني: اجمع هذا المؤشر مع أدوات أخرى مثل المتوسطات المتحركة أو المؤشرات المتذبذبة للحصول على رؤية أكثر شمولاً لاتجاهات السوق.
أدوات إدارة المخاطر: استخدم الآلات الحاسبة وأدوات وقف الخسارة للمساعدة في إدارة مخاطر التداول بفعالية حول هذه المستويات الرئيسية.
باستخدام Previous Day Equilibrium إلى جانب هذه الأدوات، يمكنك تعزيز استراتيجيتك التداولية وزيادة فرص نجاحك في عالم التداول اليومي السريع.
الملخص
تقييمات العملاء
5 | 0 % | |
4 | 100 % | |
3 | 0 % | |
2 | 0 % | |
1 | 0 % |


![شعار "[Stellar Strategies] Inside Bar with Signals"](https://cdn.ctrader.com/image/webp/1d9e8bfa-3b2c-4440-bb37-5856902008a7_30683)

