الوصف
🔥 Pinescritlabs
مؤشرات متجر Ctrader: 🤖روبوتات متجر Pinescritlabs Ctrader:
جلسات فجوة القيمة العادلة جلسات اختراق الذهب و BTC
هيكل السوق الديناميكي
تحليل نقاط التحول
فيبوناتشي الخطي
انحدار متعدد الأطر الزمنية
انحياز الشمعة متعددة المستويات
المتعقب
دعم تلقائي و
خطوط مقاومة الاتجاه
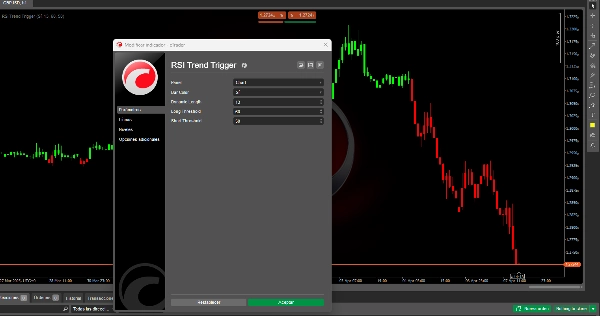
مشغل اتجاه RSI 📈✨
كيف يعمل؟ 🤔
الخطوة 1: مؤشر القوة النسبية التقليدي
يتم حساب مؤشر القوة النسبية (RSI) القياسي، الذي يقيس سرعة وحجم تحركات السعر خلال فترة محددة. يتأرجح بين 0 و 100، ويحدد حالات الشراء المفرط (مثلاً، فوق 70) وحالات البيع المفرط (مثلاً، تحت 30). 📊📉📈
الخطوة 2: التنقيح الديناميكي
يخضع مؤشر القوة النسبية التقليدي إلى عملية تنعيم متقدمة:
- يتم تطبيق حساب رياضي ثاني على قيم RSI الأصلية (وليس على السعر نفسه).
- تخلق هذه الخطوة نسخة أكثر استقرارًا من RSI، مما يقلل التقلبات الطفيفة (ضوضاء السوق) وتبرز الاتجاهات الحقيقية.
- على عكس التنعيم الأساسي، تحافظ هذه الطريقة على الاستجابة للتغيرات الكبيرة في الزخم، متجنبة التأخيرات المفرطة. 🛡️🔄
لماذا التنقيح مهم؟ 🤩
- تصفية ذكية: تقضي على الإشارات الخاطئة الناتجة عن التقلبات المؤقتة، مثل ارتفاعات الأخبار أو التحركات المضاربية. �🗑️
- اتجاهات أكثر وضوحًا: تميز طريقة الحساب المزدوج بين التصحيحات الطفيفة والانقلابات الحقيقية في الاتجاه. 🎯
- إشارات مستمرة: بمجرد تأكيد الاتجاه (صعودي/هبوطي)، يحتفظ المؤشر به حتى يحدث انقلاب واضح، متجنبًا القفزات العشوائية في الإشارة. 🔒
الاستخدام العملي: العتبات واتخاذ القرار 📈
يجمع مؤشر RSI المنقح مع عتبتين قابلتين للتعديل:
- عتبة صعودية (مثلاً، 60):
-
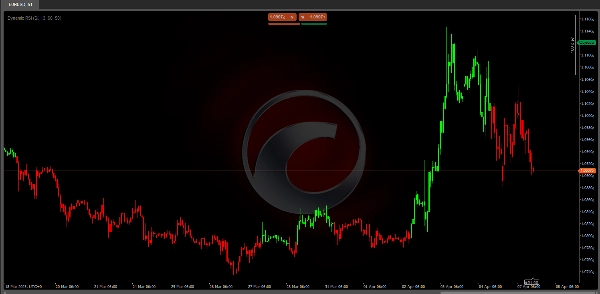
- إذا تجاوز مؤشر RSI المنقح هذا المستوى، يتم تأكيد اتجاه صعودي. 🚀
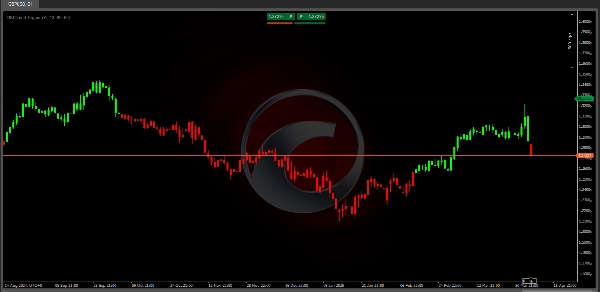
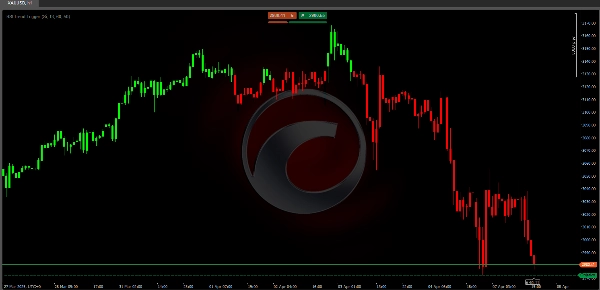
- تتحول الشموع إلى اللون الأخضر
- عتبة هبوطية (مثلاً، 50):
-
- إذا انخفض مؤشر RSI المنقح تحت هذا المستوى، يتم تفعيل اتجاه هبوطي. 📉
- تتحول الشموع إلى اللون الأحمر
القاعدة الأساسية:
- تظهر الإشارات فقط أثناء تغيرات الاتجاه (ليس عند كل تقلب)، مما يقلل من الحمل المعلوماتي الزائد. 🚫📢
- العتبات قابلة للتخصيص: استخدم قيمًا أعلى (مثلاً، 65/55) للأسواق المتقلبة أو قيمًا أقل (مثلاً، 55/45) للاتجاهات الأكثر سلاسة. ⚙️
فوائد للمتداولين 🏆
- دقة محسنة:
-
- إشارات خاطئة أقل بفضل التصفية ذات الطبقتين. مثالي للأسواق الجانبية أو الإشارات الكاذبة. ✅
- تصور بديهي:
-
- الشموع الملونة والعتبات المرئية تتيح لك اكتشاف الاتجاهات فورًا. 👀🎨
- قابلية التكيف:
-
- يعمل عبر الأصول (الفوركس، الأسهم، العملات الرقمية) والأطر الزمنية (من دقائق إلى أسابيع). 🌍⏳
- تداول مركز على الاتجاه:
-
- يساعد على التداول مع الزخم، متجنبًا التحركات المضادة للاتجاه الخطرة. 🎯🚦
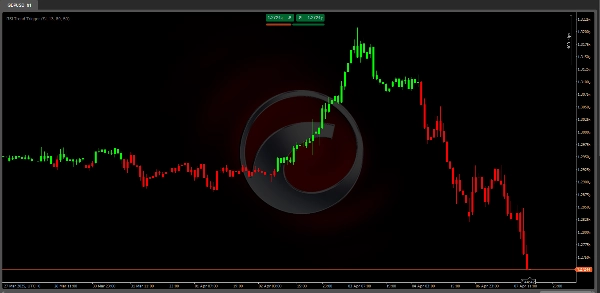
مثال على تدفق الإشارة
تخيل أن مؤشر RSI المنقح عند 55 (منطقة محايدة):
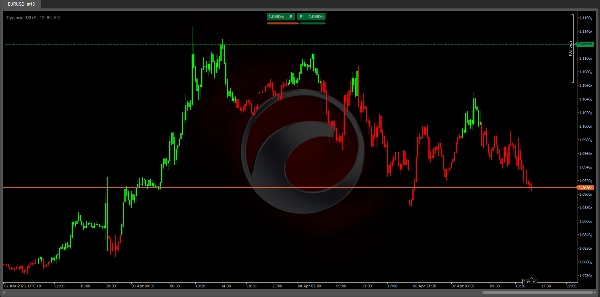
- السيناريو الصعودي: يرتفع إلى 62 → يتجاوز عتبة 60 → تتحول الشموع إلى اللون الأخضر🚀
- السيناريو الهبوطي: ينخفض إلى 48 → يكسر عتبة 50 → تتحول الشموع إلى اللون الأحمر📉
الملخص
The indicator then applies an advanced smoothing process to the RSI values, not the price data, creating a refined RSI that reduces minor market noise while maintaining sensitivity to significant momentum changes. This dual-layer calculation enhances signal precision by filtering out false signals caused by temporary volatility and distinguishing between minor corrections and genuine trend reversals.
Users can customize two threshold levels—a bullish threshold (e.g., 60) and a bearish threshold (e.g., 50)—to define when a trend is confirmed. When the refined RSI crosses above the bullish threshold, the indicator signals a bullish trend with green candles; when it falls below the bearish threshold, it signals a bearish trend with red candles. Signals appear only during trend changes, reducing information overload.
The RSI Trend Trigger supports multiple timeframes from minutes to weeks and is adaptable to different market conditions, aiding traders in aligning with momentum and avoiding counter-trend risks.
تقييمات العملاء
5 | 67 % | |
4 | 33 % | |
3 | 0 % | |
2 | 0 % | |
1 | 0 % |