Описание
Trend Entropy – Бесплатный индикатор cTrader
Энтропия — это научная мера беспорядка или неопределённости в системе. В физике она показывает, как рассеивается энергия и почему системы стремятся к хаосу. В теории информации она измеряет непредсказуемость данных. Низкая энтропия означает порядок и предсказуемость, тогда как высокая энтропия отражает случайность, сложность и снижение ясности результатов.
Откройте для себя силу порядка внутри хаоса. Trend Entropy — это современный технический индикатор, разработанный для измерения организации против случайности ценовых движений. В отличие от традиционных осцилляторов, которые отслеживают только импульс или волатильность, Trend Entropy применяет продвинутые вычисления энтропии, чтобы показать, движется ли рынок структурированно или скатывается в хаотичный флэт.
Этот бесплатный инструмент создан для трейдеров, желающих глубже понять скрытую динамику ценового действия. Сочетая статистическую энтропию с сглаживанием в стиле RSI и адаптивными порогами, Trend Entropy преобразует сырую волатильность в чёткую нормализованную шкалу от 0% до 100%. В результате получается одна элегантная линия, которая показывает, находится ли рынок в сильном тренде, нейтральной консолидации или волатильном диапазоне.
Как читать Trend Entropy
Низкие значения (0–33%): Рынок организован. Если средняя доходность положительна, это указывает на вероятный восходящий тренд. Если отрицательна — сигнализирует о вероятном нисходящем тренде.
Средние значения (34–66%): Нейтральная зона. Рынок может консолидироваться с лёгким уклоном в бычью или медвежью сторону в зависимости от средней доходности.
Высокие значения (67–100%): Доминирует хаос. Ценовое движение находится в диапазоне, непредсказуемо и менее надёжно для стратегий следования за трендом.
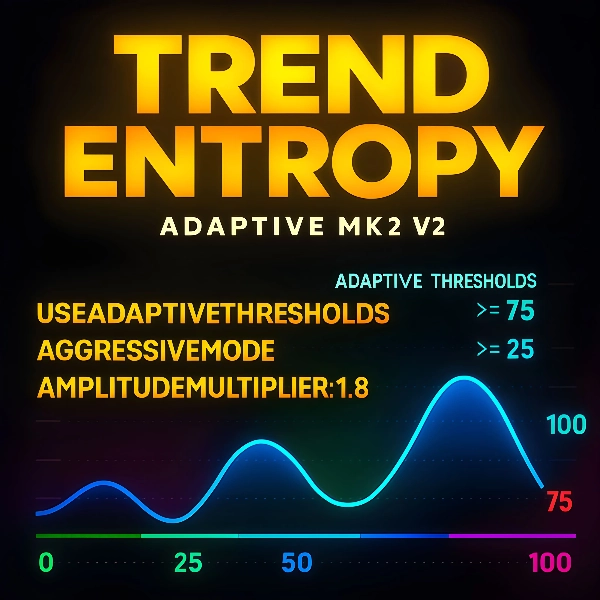
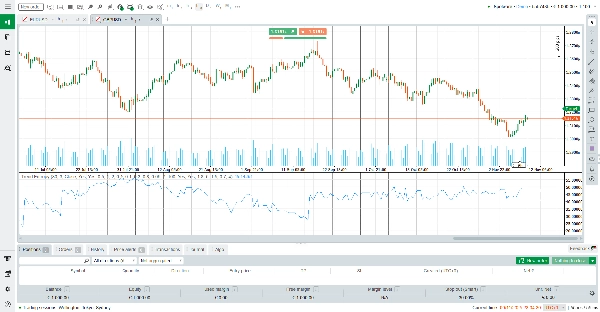
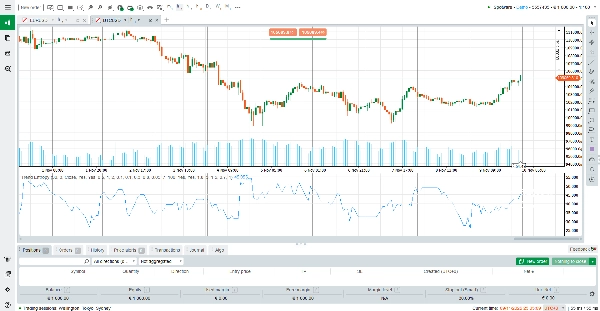
Горизонтальные ориентиры на 25%, 50% и 75% упрощают интерпретацию. Трейдеры могут мгновенно видеть, сжимается ли энтропия к порядку или расширяется к хаосу.
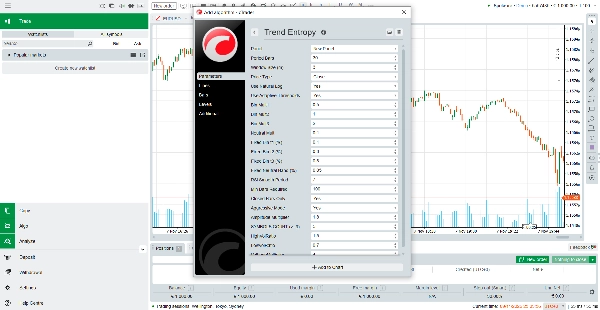
Как работает индикатор
Trend Entropy вычисляет доходности за выбранный период и отображает их в символические состояния. Эти состояния анализируются в перекрывающихся окнах для построения частотного распределения ценовых паттернов. С помощью математики энтропии индикатор измеряет степень беспорядка в этих последовательностях.
Для практичности результат нормализуется в процентную шкалу и затем сглаживается методом усреднения в стиле Уайлдера. Адаптивные пороги обеспечивают подстройку индикатора под текущую волатильность, а агрессивный режим усиливает сигналы для трейдеров, предпочитающих более резкие отклики. В конце применяются коэффициенты волатильности для уточнения показаний, повышая значения в хаотичных условиях и понижая в стабильных.
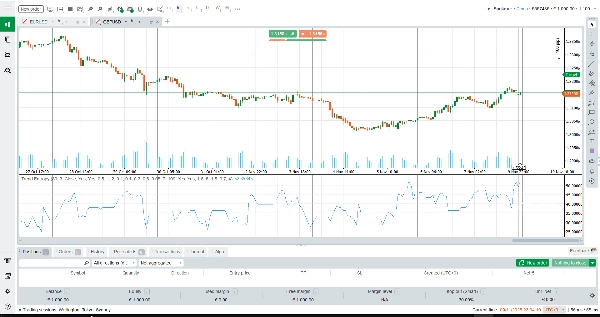
В итоге получается одна сглаженная линия, которая отражает суть структуры рынка: движется ли цена упорядоченно или скатывается в случайность.
Ключевые особенности
Анализ на основе энтропии — выходит за рамки импульса, измеряя истинную организацию ценового действия.
Адаптивные пороги — автоматически подстраиваются под волатильность, сохраняя актуальность сигналов в любых рыночных условиях.
Сглаживание в стиле RSI — обеспечивает чистую, стабильную линию, избегая шумных колебаний.
Интеграция волатильности — повышает точность, сравнивая краткосрочные и долгосрочные коэффициенты волатильности.
Чёткий визуальный дизайн — горизонтальные уровни и одна линия DodgerBlue делают интерпретацию простой.
Почему стоит выбрать Trend Entropy?
Trend Entropy — это не просто очередной осциллятор. Это гибридный инструмент, сочетающий статистическую точность с удобной визуализацией для трейдера. Независимо от того, являетесь ли вы трендовым трейдером, ищущим подтверждения, или трейдером диапазона, стремящимся избежать хаотичных рынков, этот индикатор даст вам необходимую ясность.
Сводка
The indicator outputs a single smoothed line on a normalized scale from 0% to 100%, where low values (0–33%) indicate organized trending markets, mid values (34–66%) suggest neutral or consolidating conditions, and high values (67–100%) reflect chaotic, ranging markets. Horizontal reference lines at 25%, 50%, and 75% aid interpretation.
Trend Entropy pro incorporates RSI-style smoothing, adaptive thresholds that adjust to current volatility, and volatility ratio integration to enhance signal accuracy. It is designed to provide traders with deeper insight into market dynamics beyond traditional momentum or volatility indicators, supporting analysis across various markets including Forex, cryptocurrencies, commodities, indices, and stocks.
This indicator is suitable for traders seeking to identify trending versus ranging conditions and improve decision-making in trend-following or range-trading strategies.