![Trading product for [Stellar Strategies] BOS Trend 1.0 Indikator, image 1](https://cdn.ctrader.com/image/webp/6cdec0f1-0e97-4a82-a8a4-2b67aed54d38_25695)
[Stellar Strategies] BOS Trend 1.0
Indikator
455 muat turun
Versi 1.0, Nov 2024
Windows, Mac
5.0
Ulasan: 1
![Trading product for [Stellar Strategies] BOS Trend 1.0 Indikator, image 2](https://cdn.ctrader.com/image/webp/2738d263-76dc-4e6f-a818-7e66349e6883_25696)
![Trading product for [Stellar Strategies] BOS Trend 1.0 Indikator, image 3](https://cdn.ctrader.com/image/webp/5338cc95-bf3e-4db4-b575-3e935cff8e90_25697)
![Trading product for [Stellar Strategies] BOS Trend 1.0 Indikator, image 4](https://cdn.ctrader.com/image/webp/59502053-3cfb-4232-b1da-c27ad8852e60_25698)
![Trading product for [Stellar Strategies] BOS Trend 1.0 Indikator, image 5](https://cdn.ctrader.com/image/webp/e32ea74f-662d-4c30-8571-3b8062b6be90_25699)
![Trading product for [Stellar Strategies] BOS Trend 1.0 Indikator, image 6](https://cdn.ctrader.com/image/webp/fe0c3dd9-19fe-4833-bd0e-640ccec47e31_25700)
![Trading product for [Stellar Strategies] BOS Trend 1.0 Indikator, image 7](https://cdn.ctrader.com/image/webp/0fa38032-d41c-4684-a0ec-c9512db0d567_25701)
![Trading product for [Stellar Strategies] BOS Trend 1.0 Indikator, image 8](https://cdn.ctrader.com/image/webp/10e865d7-9813-4932-ac9b-3b76516518c9_25702)
Penerangan
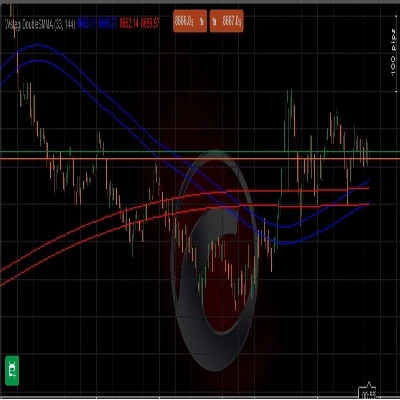
The [Stellar Strategies] BOS Trend adalah penunjuk Break of Structure (BOS) pelbagai jangka masa premium yang direka untuk cAlgo. Ia memberikan pedagang pandangan penting mengenai trend pasaran dengan mengesan BOS tren menaik dan menurun merentasi pelbagai jangka masa.
Ciri-ciri:
- Analisis Pelbagai Jangka Masa: Menganalisis pergerakan harga merentasi pelbagai jangka masa (1 minit hingga harian).
- Jangka Masa Boleh Disesuaikan: Aktifkan atau nyahaktifkan jangka masa tertentu untuk menyesuaikan analisis anda.
- Amaran Masa Nyata: Memaparkan mesej pada carta apabila BOS dikesan.
- Antara Muka Mesra Pengguna: Warna teks boleh disesuaikan untuk keterlihatan lebih baik pada latar belakang carta yang berbeza.
Parameter:
- Tempoh Lookback (Default: 20): Bilangan bar untuk dilihat semula semasa mengesan BOS.
- Parameter Jangka Masa:
-
Gunakan Jangka Masa 1 MinitGunakan Jangka Masa 5 MinitGunakan Jangka Masa 15 MinitGunakan Jangka Masa 30 MinitGunakan Jangka Masa 1 JamGunakan Jangka Masa 4 JamGunakan Jangka Masa Harian
- Warna Teks (Default: "Kuning"): Menetapkan warna untuk mesej BOS.
Cara Menggunakan Penunjuk:
- Menambah Penunjuk:
-
- Buka platform cAlgo anda.
- Navigasi ke bahagian penunjuk dan tambah [Stellar Strategies] BOS Trend ke carta anda.
- Menetapkan Parameter:
-
- Tempoh Lookback: Laraskan tempoh lookback mengikut strategi perdagangan anda (default adalah 20 bar).
- Aktifkan/Nyahaktifkan Jangka Masa: Pilih jangka masa yang anda mahu analisis dengan menandakan atau mengosongkan pilihan yang berkaitan.
- Warna Teks: Pilih warna teks yang kontras dengan latar belakang carta anda untuk keterlihatan yang jelas.
- Membaca Isyarat BOS:
-
- BOS Tren Menaik: Garis hijau menunjukkan break of structure tren menaik.
- BOS Tren Menurun: Garis merah menunjukkan break of structure tren menurun.
- Mesej BOS: Mesej seperti "Current TF: Uptrend BOS detected" akan muncul pada carta, bersama mesej lain dari jangka masa yang anda aktifkan.
- Mentafsir Data:
-
- Gunakan isyarat BOS untuk mengenal pasti kemungkinan pembalikan atau kesinambungan tren.
- Berikan perhatian kepada analisis pelbagai jangka masa untuk pengesahan tren yang lebih kukuh.
- Menyesuaikan Paparan:
-
- Anda boleh melaraskan warna teks dan kedudukan mesej BOS untuk keterbacaan yang lebih baik.
Contoh:
Berikut adalah contoh langkah demi langkah cara menggunakan [Stellar Strategies] BOS Trend penunjuk:
- Tambah Penunjuk:
-
- Buka carta dalam platform cAlgo anda.
- Pergi ke
Indicatorsdan pilih [Stellar Strategies] BOS Trend.
- Tetapkan Parameter:
-
- Tetapkan
Lookback Periodkepada 20. - Aktifkan
Use 1 Minute Time Frame,Use 5 Minute Time Frame, dan jangka masa lain mengikut keperluan. - Tetapkan
Text Colorkepada "Kuning" untuk keterlihatan lebih baik.
- Tetapkan
- Pantau Carta:
-
- Perhatikan garis BOS hijau (tren menaik) dan merah (tren menurun) pada carta anda.
- Cari mesej yang menunjukkan pengesanan BOS merentasi jangka masa yang berbeza.
- Ambil Tindakan:
-
- Gunakan isyarat BOS untuk membuat keputusan perdagangan yang berinformasi berdasarkan pembalikan atau kesinambungan tren.
Dengan mengikuti langkah-langkah ini, anda boleh menggunakan penunjuk [Stellar Strategies] BOS Trend dengan berkesan untuk meningkatkan strategi perdagangan anda dengan analisis BOS pelbagai jangka masa.
Sila beritahu saya jika anda memerlukan bantuan lanjut atau maklumat tambahan! 📈📉
Ringkasan
Ringkasan AI
The [Stellar Strategies] BOS Trend is a multi-timeframe Break of Structure (BOS) indicator designed for the cAlgo platform. It identifies key market trend shifts by detecting uptrend and downtrend BOS signals across multiple timeframes ranging from 1 minute to daily charts. Users can customize which timeframes to analyze and adjust the lookback period for BOS detection, with a default of 20 bars. The indicator provides real-time alerts directly on the chart, displaying messages such as "Current TF: Uptrend BOS detected" to inform traders of structural breaks. Visual cues include green lines for uptrend BOS and red lines for downtrend BOS. The interface allows customization of text color to enhance visibility against different chart backgrounds. Traders can use the BOS signals to identify potential trend reversals or continuations, leveraging multi-timeframe analysis for stronger confirmation. The indicator supports flexible configuration to fit various trading strategies and preferences.
Profil indikator
Ulasan pelanggan
5.0
Ulasan: 1
5 | 100 % | |
4 | 0 % | |
3 | 0 % | |
2 | 0 % | |
1 | 0 % |
Ulasan pelanggan
August 18, 2025
Pros: Automatically detects and marks Break Of Structure points indicating trend shifts. Clean visual arrows and straightforward setup. Cons: No alerts, tooltips, or template saving. May produce noise without volume or market context filters.
Perbincangan
Soalan Lazim
Produk yang tersedia melalui cTrader Store, termasuk bot dagangan, indikator dan plugin, disediakan oleh pembangun pihak ketiga dan diberikan akses untuk tujuan maklumat dan teknikal sahaja. cTrader Store bukan broker dan tidak memberikan nasihat pelaburan, syor peribadi atau sebarang jaminan prestasi masa hadapan.
Lebih banyak produk daripada penulis ini
![Logo "[Stellar Strategies] Market Structure Breakout"](https://cdn.ctrader.com/image/webp/bceec265-3247-4b11-915f-6295a29c106d_28465)
![Logo "[Stellar Strategies] Market Session Ultimate"](https://cdn.ctrader.com/image/webp/61ffd537-0125-4246-9e72-42eca1791d64_28232)
![Logo "[Stellar Strategies] Wave Trend Pro"](https://cdn.ctrader.com/image/webp/5f226fbb-245a-41cd-9cdd-b018257d5e6d_28617)
![Logo "[Stellar Strategies] Inside Bar with Signals"](https://cdn.ctrader.com/image/webp/1d9e8bfa-3b2c-4440-bb37-5856902008a7_30683)
![Logo "[Stellar Strategies] Linear Regression Candles 1.1"](https://cdn.ctrader.com/image/webp/8b9cff9f-2431-46d2-b0ec-c7f55f4a4a6d_27918)
![Logo "[Stellar Strategies] Smart ADX"](https://cdn.ctrader.com/image/webp/af13b084-b6f6-41db-b7bc-c7e688b57b05_36929)
![Logo "[StellarStrategies] Scheduled Trade Executor"](https://cdn.ctrader.com/image/webp/daefc6af-7eca-453e-878d-1b981be2c401_25646)
![Logo "[Stellar Strategies] VBO"](https://cdn.ctrader.com/image/webp/f034c012-94d4-445a-a01b-febd1cdedaef_36944)
![Logo "[Stellar Strategies] SP500 Gap Closure cBot 1.0"](https://cdn.ctrader.com/image/webp/92c23fdc-4ad1-4e61-bdb5-c77f6ec8c539_27686)
![Logo "[Stellar Strategies] Candlestick Patterns Dashboard"](https://cdn.ctrader.com/image/webp/ae8691a5-4884-4553-9bcc-64e16ac82a30_38344)
![Logo "[Stellar Strategies] QQE"](https://cdn.ctrader.com/image/webp/e702104a-874c-4b39-97dd-fb34518d1015_27712)
![Logo "[Stellar Strategies] Visual Trend Momentum"](https://cdn.ctrader.com/image/webp/48aee0a5-f10e-4bc8-9671-78e156fcc5df_27548)


Harga
20.46M
Volum yang didagangkan
8K
Pip dimenangi
25
Jualan
4.34K
Pemasangan percuma