![Trading product for [Stellar Strategies] Market Structure Breakout Indicador Signal Breakout, image 1](https://cdn.ctrader.com/image/webp/bceec265-3247-4b11-915f-6295a29c106d_28465)
![Trading product for [Stellar Strategies] Market Structure Breakout Indicador Signal Breakout, image 2](https://cdn.ctrader.com/image/webp/01ab79aa-faea-416f-a7e8-dac2f6195047_28466)
![Trading product for [Stellar Strategies] Market Structure Breakout Indicador Signal Breakout, image 3](https://cdn.ctrader.com/image/webp/3588f2c0-dd5a-4df4-967c-fe2b4de791f8_28467)
![Trading product for [Stellar Strategies] Market Structure Breakout Indicador Signal Breakout, image 4](https://cdn.ctrader.com/image/webp/c098fda7-69e9-4b38-92b0-1561a798b674_28468)
![Trading product for [Stellar Strategies] Market Structure Breakout Indicador Signal Breakout, image 5](https://cdn.ctrader.com/image/webp/4a442b80-f948-483a-bd0a-8ce3767e6b2e_28469)
Descripción
Indicador de Ruptura de Estructura de Mercado
Resumen
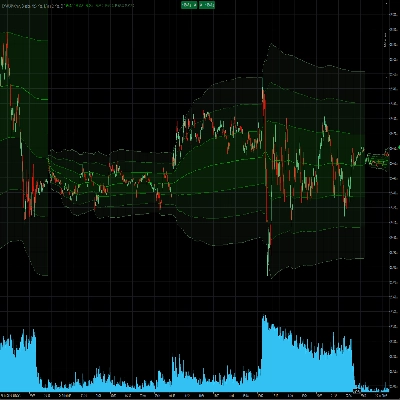
Este indicador está diseñado para identificar oportunidades potenciales de trading detectando rupturas de rangos de precios recientes en su gráfico de cTrader. Resalta visualmente cuando el precio cierra significativamente por encima de un máximo reciente (potencial continuación/reversión alcista) o por debajo de un mínimo reciente (potencial continuación/reversión bajista), inspirándose en conceptos de ruptura de estructura de mercado.
Cómo Funciona
- Identificación del Rango: Para cada barra, el indicador revisa un número especificado de barras anteriores (definido por
Lookback Period). Identifica el precio máximo absoluto más alto y el precio mínimo más bajo alcanzados dentro de ese período. - Detección de Ruptura: Verifica si el precio de cierre de la barra actual es más alto que el máximo más alto encontrado en el período de revisión (una ruptura alcista) o más bajo que el mínimo más bajo (una ruptura bajista).
- Filtrado de Tendencia (Opcional): Si
Enable Trend Filterestá configurado entrue, el indicador también verifica el precio en relación con una Media Móvil (Trend MA Period&Trend MA Type). -
- Una señal de ruptura alcista solo se considera válida si el precio de cierre también está por encima de la Media Móvil.
- Una señal de ruptura bajista solo se considera válida si el precio de cierre también está por debajo de la Media Móvil. Esto ayuda a filtrar rupturas que van en contra de la tendencia predominante definida por la MA.
Elementos Visuales
- Flechas:
-
- Una Flecha Alcista (por defecto LimeGreen) aparece debajo del mínimo de una barra que cierra por encima del máximo más alto reciente (y satisface el filtro de tendencia, si está habilitado).
- Una Flecha Bajista (por defecto Rojo) aparece encima del máximo de una barra que cierra por debajo del mínimo más bajo reciente (y satisface el filtro de tendencia, si está habilitado).
- La distancia de la flecha desde la barra se ajusta automáticamente según la volatilidad del mercado usando ATR (
Arrow ATR Offset Multiplier).
- Líneas Horizontales:
-
- Cuando ocurre una ruptura alcista, se dibuja una Línea de Resistencia Rota (por defecto Rojo) en el nivel del máximo más alto que fue roto.
- Cuando ocurre una ruptura bajista, se dibuja una Línea de Soporte Rota (por defecto LimeGreen) en el nivel del mínimo más bajo que fue roto.
- Estas líneas comienzan desde la barra donde ocurrió el pivote alto/bajo y se extienden hacia adelante más allá de la barra de ruptura por un número de barras definido por
Line Extension Bars. Esto ayuda a visualizar el nivel roto. - El estilo y grosor de la línea pueden personalizarse.
- Etiquetas (Opcional):
-
- Si
Label Typeno está configurado enNone, aparece una etiqueta de texto cerca del final de la línea horizontal extendida. - Esto puede mostrar el nivel real de
Price, texto personalizadoText(como "MSB"), oBoth. - El color de la etiqueta es personalizable.
- Si
- Límite de Historial: Solo se muestran el número más reciente de señales alcistas y bajistas (flecha + línea + etiqueta) definido por
Max Historical Breakoutspara mantener el gráfico limpio. Configurar esto en 0 muestra todas.
Cómo Usar y Qué Buscar
- Señales de Entrada: Las flechas de ruptura pueden señalar posibles puntos de entrada en la dirección de la ruptura. Una flecha alcista sugiere una posible entrada larga, mientras que una flecha bajista sugiere una posible entrada corta.
- Confirmación: Use las rupturas junto con otras formas de análisis (por ejemplo, análisis de volumen, patrones gráficos, análisis fundamental) para confirmar señales. No dependa únicamente de este indicador.
- Soporte/Resistencia: Las líneas horizontales dibujadas por el indicador representan niveles de precio donde el precio se detuvo previamente. Después de una ruptura, estos niveles pueden invertir sus roles:
-
- Un nivel de resistencia roto (línea roja) podría actuar como soporte potencial futuro.
- Un nivel de soporte roto (línea verde) podría actuar como resistencia potencial futura. Observe cómo el precio interactúa con estas líneas extendidas en barras posteriores.
- Contexto de Tendencia: Habilitar el
Trend Filterpuede ayudarle a enfocarse en rupturas que se alinean con la dirección general del mercado, reduciendo potencialmente operaciones en contra de tendencias fuertes. - Ajuste de Parámetros: Experimente con el
Lookback Period. Períodos más cortos serán más sensibles y generarán más señales (potencialmente más ruido). Períodos más largos identificarán rupturas de rangos más significativos pero generarán menos señales. Ajuste según el marco temporal y las características del mercado. Ajuste elTrend MA Periodpara definir la tendencia que desea seguir. - Marcos Temporales: El indicador funciona en cualquier marco temporal. Recuerde que un
Lookback Periodde 20 significa 20 barras de ese marco temporal específico.
Alertas
- Si
Enable Sound Alertsestá entrue, el indicador reproducirá elAlert Sound Fileespecificado cuando aparezca una señal de ruptura nueva en la barra en tiempo real más reciente (no alertará durante pruebas retrospectivas o carga de historial).
Parámetros Clave
Lookback Period: Número de barras pasadas para encontrar el máximo más alto/mínimo más bajo.Enable Trend Filter: Activa o desactiva el filtro de Media Móvil.Trend MA Period/Type: Configuraciones para la Media Móvil que filtra la tendencia.Max Historical Breakouts: Limita cuántas señales pasadas se muestran.Arrow ATR Offset Multiplier: Controla la distancia de la flecha desde la barra según la volatilidad.Line Extension Bars: Qué tan lejos se extiende la línea horizontal más allá de la ruptura.Label Type/Custom Label Text: Controla la visualización de etiquetas en las líneas.Enable Sound Alerts/Alert Sound File: Configura alertas de audio.- Parámetros de Color/Estilo: Personaliza la apariencia visual.
Descargo de Responsabilidad: El trading implica riesgos. Este indicador proporciona señales técnicas basadas en sus cálculos, pero no garantiza ganancias ni predice el futuro. Siempre utilice gestión de riesgos y realice su propio análisis antes de tomar cualquier decisión de trading.
Resumen
Visual cues include lime green bullish arrows below bars breaking above highs and red bearish arrows above bars breaking below lows. These arrows are positioned dynamically based on market volatility using the ATR (Average True Range). The indicator also draws horizontal lines at broken support or resistance levels, extending forward to help visualize these key price levels. Labels can be optionally displayed on these lines, showing price, custom text, or both, with customizable colors.
Users can limit the number of historical breakout signals shown to maintain chart clarity. Sound alerts can be enabled to notify when new breakout signals occur in real time. The indicator works on any timeframe, with sensitivity adjustable via the lookback period and trend filter settings. It is intended to assist in identifying entry points and support/resistance levels but should be used alongside other analysis methods.
Valoraciones de clientes
5 | 100 % | |
4 | 0 % | |
3 | 0 % | |
2 | 0 % | |
1 | 0 % |
![Logotipo de "[Stellar Strategies] BOS Trend 1.0"](https://cdn.ctrader.com/image/webp/6cdec0f1-0e97-4a82-a8a4-2b67aed54d38_25695)
![Logotipo de "[Stellar Strategies] Market Session Ultimate"](https://cdn.ctrader.com/image/webp/61ffd537-0125-4246-9e72-42eca1791d64_28232)
![Logotipo de "[Stellar Strategies] Wave Trend Pro"](https://cdn.ctrader.com/image/webp/5f226fbb-245a-41cd-9cdd-b018257d5e6d_28617)
![Logotipo de "[Stellar Strategies] Inside Bar with Signals"](https://cdn.ctrader.com/image/webp/1d9e8bfa-3b2c-4440-bb37-5856902008a7_30683)
![Logotipo de "[Stellar Strategies] Linear Regression Candles 1.1"](https://cdn.ctrader.com/image/webp/8b9cff9f-2431-46d2-b0ec-c7f55f4a4a6d_27918)
![Logotipo de "[Stellar Strategies] Smart ADX"](https://cdn.ctrader.com/image/webp/af13b084-b6f6-41db-b7bc-c7e688b57b05_36929)
![Logotipo de "[StellarStrategies] Scheduled Trade Executor"](https://cdn.ctrader.com/image/webp/daefc6af-7eca-453e-878d-1b981be2c401_25646)
![Logotipo de "[Stellar Strategies] VBO"](https://cdn.ctrader.com/image/webp/f034c012-94d4-445a-a01b-febd1cdedaef_36944)
![Logotipo de "[Stellar Strategies] SP500 Gap Closure cBot 1.0"](https://cdn.ctrader.com/image/webp/92c23fdc-4ad1-4e61-bdb5-c77f6ec8c539_27686)
![Logotipo de "[Stellar Strategies] Candlestick Patterns Dashboard"](https://cdn.ctrader.com/image/webp/ae8691a5-4884-4553-9bcc-64e16ac82a30_38344)
![Logotipo de "[Stellar Strategies] QQE"](https://cdn.ctrader.com/image/webp/e702104a-874c-4b39-97dd-fb34518d1015_27712)
![Logotipo de "[Stellar Strategies] Visual Trend Momentum"](https://cdn.ctrader.com/image/webp/48aee0a5-f10e-4bc8-9671-78e156fcc5df_27548)