
WaveWeisBarForce
Indikator
169 muat turun
Versi 1.0, Dec 2025
Windows, Mac
5.0
Ulasan: 2
Penerangan
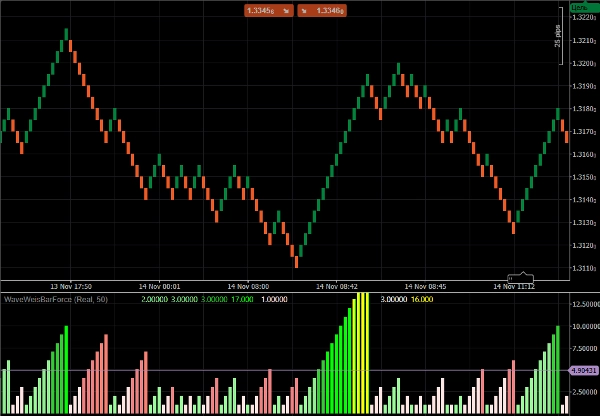
Wave Weis Bar Force - adalah penunjuk yang menggunakan logik gelombang Volume (Weis) untuk menentukan pengumpulan dan perubahan arah pasaran.
Ia merumuskan jumlah volum sementara trend kekal tidak berubah. Apabila arah berubah, gelombang baru bermula dan pengumpulan diset semula.
Kekuatan dikira mengikut tahap, berdasarkan nisbah antara volum gelombang semasa dan pengumpulan terbesar baru-baru ini. Ia berfungsi sebagai penapis tambahan dan menunjukkan prestasi yang baik pada strategi trending.
Ringkasan
Ringkasan AI
Wave Weis Bar Force is a technical indicator that applies the concept of Volume Waves (Weis) to identify market accumulation phases and detect changes in market direction. It aggregates volume data while the current trend persists, resetting accumulation when a new wave begins with a trend reversal. The indicator calculates intensity levels based on the ratio of the current wave's volume to the largest recent accumulation, providing a quantitative measure of volume strength. This functionality serves as an additional filter and is particularly useful in trending market strategies. The indicator supports analysis across multiple markets including Forex, Crypto, and Stocks, and is applicable to trading approaches such as breakout and scalping strategies.
Profil indikator
Ulasan pelanggan
5.0
Ulasan: 2
5 | 100 % | |
4 | 0 % | |
3 | 0 % | |
2 | 0 % | |
1 | 0 % |
Ulasan pelanggan
December 10, 2025
WaveWeisBarForce blends Weis Wave logic with bar-strength analysis to show real buying/selling force. Clean histogram, stable performance, great for confirming impulses and spotting exhaustion. Useful for Wyckoff, VSA and intraday momentum traders.
Perbincangan
Soalan Lazim
Forex
Breakout
Scalping
Crypto
Stocks
Produk yang tersedia melalui cTrader Store, termasuk bot dagangan, indikator dan plugin, disediakan oleh pembangun pihak ketiga dan diberikan akses untuk tujuan maklumat dan teknikal sahaja. cTrader Store bukan broker dan tidak memberikan nasihat pelaburan, syor peribadi atau sebarang jaminan prestasi masa hadapan.
Lebih banyak produk daripada penulis ini


Harga
Sejak 24/10/2025
1.43M
Volum yang didagangkan
4.79K
Pip dimenangi
2
Jualan
317
Pemasangan percuma