
설명
업그레이드된 버전 이용 가능 여기
기본 타임프레임 오버레이 이상의 기능을 찾고 계신가요? 업그레이드된 커스텀 타임프레임 인디케이터는 강력한 추가 기능으로 이 개념을 확장합니다:
- 비표준 기간 (5시간, 7시간, 9시간-23시간, 25분, 35분, 50분, 55분, 4일, 2주, 3주, 다중 월, 다중 연간)
- OHLC 라인 완료되었거나 형성 중인 바에 대한 바 오프셋 제어 포함
- 일곱 개의 피보나치 레벨 (11.4%에서 88.6%까지) 균형 영역 하이라이트 포함
- 이동 평균 커스텀 타임프레임 구조에서 직접 계산 (9가지 MA 유형, 8가지 가격 소스)
- 토글 버튼 빠른 기능 관리용.
표준 차트 간격 사이의 기간이 필요하고 완전한 기술 분석 오버레이가 필요하다면, 업그레이드된 버전을 확인하세요.
__________________________________________________________________________________________
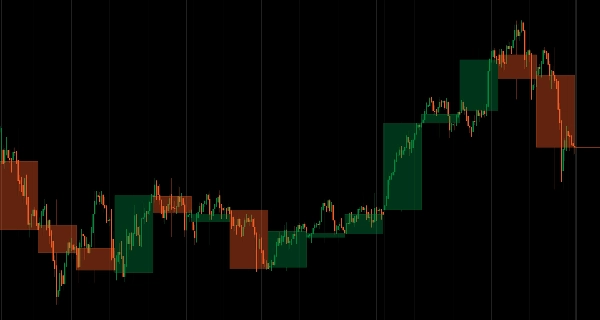
시간 프레임 전환 없이 모든 차트에 실시간 고타임프레임(HTF) 캔들 오버레이.
상위 타임프레임 캔들 구조(몸통과 심지)를 하위 타임프레임 차트에 직접 표시하며, 기간이 진행됨에 따라 실시간으로 업데이트됩니다.
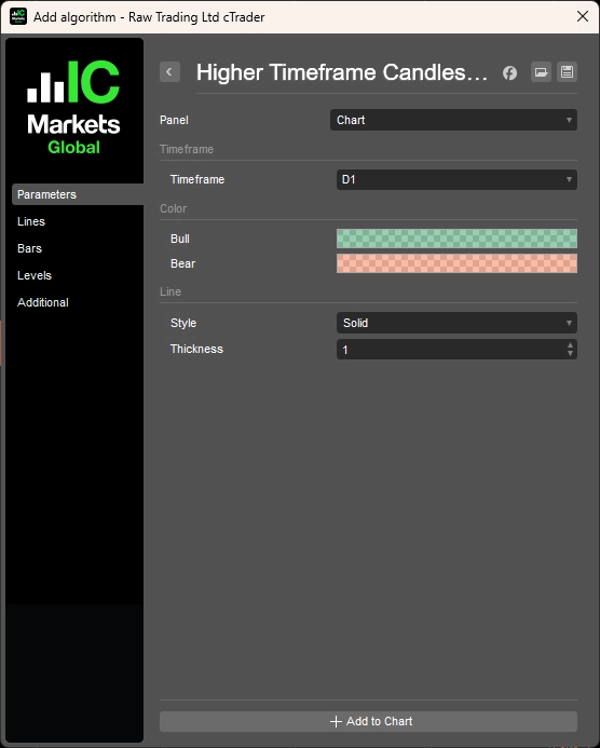
유연한 타임프레임 선택(일간을 H1에, 주간을 H4에, 월간을 일간에), 색상 코드화된 강세/약세 편향(녹색/빨강), 사용자 지정 가능한 선 스타일과 투명도, 가벼운 성능으로 여러 타임프레임에서 구조를 모니터링하는 트레이더에게 지속적인 HTF 컨텍스트를 제공합니다.
특징
유연한 타임프레임 선택
- 모든 HTF: H1에 일간, H4에 주간, 일간에 월간—선택 가능
- 실시간 업데이트: 기간 진행에 따라 HTF 캔들 재그리기
- 항상 표시: 상위 타임프레임 컨텍스트를 유지하며 하위 타임프레임 거래 가능
시각적 명확성
- 색상 코드화: 강세(녹색), 약세(빨강)—즉각적인 편향 확인
- 사용자 지정 가능: 선 스타일, 두께, 투명도
- 깔끔한 표현: 몸통과 심지가 명확하게 표시됨
간단한 통합
- 타임프레임 전환 불필요
- HTF 구조를 표시하면서 차트 컨텍스트 유지
- 가볍고 성능 최적화됨
__________________________________________________________________________________________
더 많은 무료 인디케이터
구조와 거래량부터 회귀, 변동성, 커스텀 타임프레임까지 다양한 시장 분석 도구를 탐색하세요.
소스 코드는 GitHub 저장소에서 확인할 수 있습니다.
모두 무료로 사용 가능합니다. 하지만 커피 지원을 보내고 싶다면 여기로 보내실 수 있습니다.
서포트/레지스턴스
거래량
이동 평균
유틸리티/커스텀
회귀 기반
변동성
오실레이터
__________________________________________________________________________________________
면책 조항
거래에는 위험이 따릅니다. 이 인디케이터는 기술 분석용으로만 의도되었으며, 항상 적절한 위험 관리와 책임 있는 거래를 적용하세요.
피드백 및 개선 사항
제안, 기능 요청 또는 개선 아이디어가 있으시면 토론 탭에 댓글을 남겨주세요. 여러분의 피드백은 모든 사용자를 위한 인디케이터 개선에 도움이 됩니다.


!["[Hamster-Coder] Pivot Points MTF" 로고](https://cdn.ctrader.com/image/webp/4c143e5a-309c-40e3-a578-f04d1e133ffa_31159)


