
説明
*資産クラス間で開場時間が異なります
*デフォルトの時間値はNQ/ES/YM(先物)用です
*時間値は東部標準時(EST)である必要があります
主な特徴:
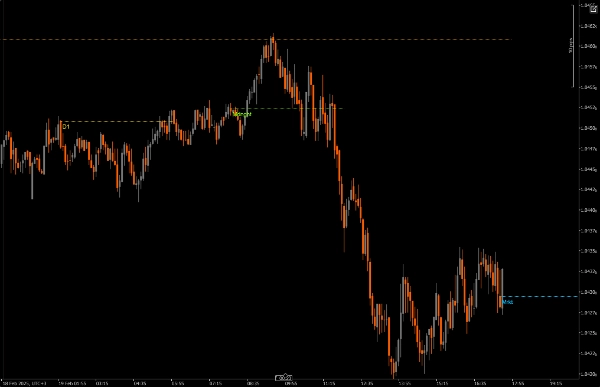
時間ベースの価格レベル
主要な市場時間の始値に価格ラインをプロット
すべての時間は東部標準時(EST)に同期されています
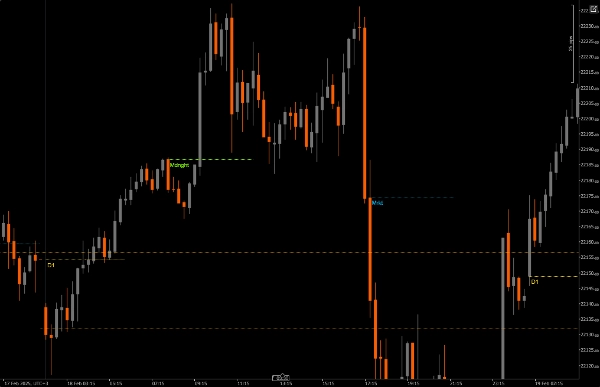
各時間帯は識別しやすいように色分けされています
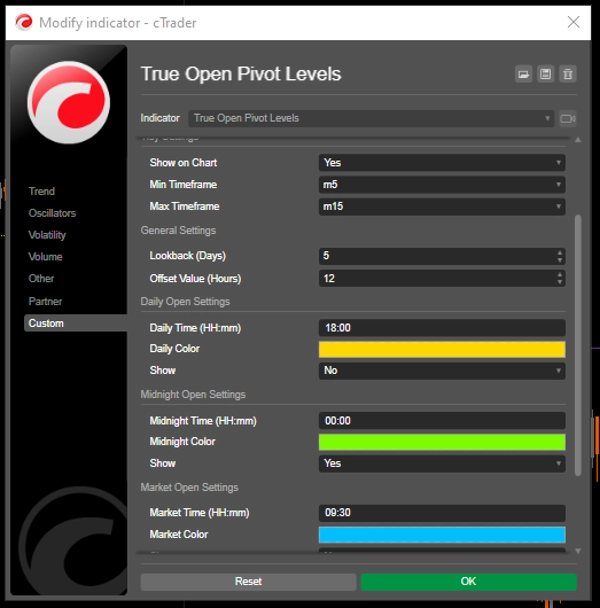
3つのカスタマイズ可能なセッションマーカー:
デイリーオープン(午前0時EST) - デフォルトはゴールド
ミッドナイトオープン(午前4時EST) - デフォルトはグリーン
マーケットオープン(午前9時30分EST) - デフォルトはブルー
各セッションは独立してオン/オフ切り替え可能
視覚的カスタマイズ:
調整可能な線の太さ
複数の線スタイル(実線、点線、破線)
各セッションのカスタマイズ可能な色
EST時間を表示するオプションの時間ラベル
最大48時間まで設定可能なラインオフセット
柔軟な時間枠サポート:
表示のための最小および最大時間枠を設定
不適切な時間枠でのチャートの混雑を防止
M5〜M15の時間枠に最適化
時間設定:
すべての時間はESTです
取引戦略に合わせてセッション時間をカスタマイズ
分析ニーズに基づいてラインの期間を調整
視覚設定:
視認性のための線の太さを調整
チャートの明瞭さに基づいて線のスタイルを選択
必要に応じてラベルの有効/無効を切り替え
チャートテーマに合わせて色をカスタマイズ
一般設定:
最小/最大時間枠を定義
拡張分析のためにラインの期間を調整
ベストプラクティス:
デフォルト設定から始めて、ニーズに応じて調整
明確な区別のために各セッションに異なる色を使用
混雑を防ぐために低い時間枠でラインの期間を短縮することを検討
タイミングを理解するために最初はラベルを有効にし、チャートが混雑したら無効にする
インジケーターの時間枠設定を取引時間枠に合わせる
このインジケーターは特に以下に有用です:
米国市場に焦点を当てるデイトレーダー
セッションの開始を追跡する必要があるトレーダー
主要な市場イベント周辺で取引する人
複数セッションの価格動向を分析するトレーダー
EST市場時間の明確な視覚的参照が必要な人
概要
カスタマーレビュー
5 | 100 % | |
4 | 0 % | |
3 | 0 % | |
2 | 0 % | |
1 | 0 % |


