
📊 VPOC MONTE CARLO BEKLENEN DEĞERİ
https://chartshots.spotware.com/c/69c558e2c68df
Entegre Piyasa Analizi: Hacim Profili + İstatistiksel Projeksiyon 🎯
🎯 BU NEDİR?
VPOC Monte Carlo Beklenen Değeri, iki profesyonel ticaret metodolojisini birleştiren nicel bir analiz göstergesidir:
- Piyasa Derinliği Profili (VPOC) - Hacmin gerçekten yoğunlaştığı yerleri belirler 🏦
- Monte Carlo Simülasyonu - İstatistiksel olasılıklara dayalı gelecekteki senaryoları projekte eder 📈
Sonuç, paranın nerede olduğunu (Kontrol Noktası) ve nereye gitme olasılığının yüksek olduğunu (projeksiyon Beklenen Değer) söyleyen bir analiz sistemidir 🧠
⚙️ NASIL ÇALIŞIR?
Modül 1: Derinlik Profili (VPOC) 📊
Gösterge son 200 barı (ayar yapılabilir) analiz eder ve hacmi 30 fiyat seviyesine dağıtır. Şunları hesaplar:
- Kontrol Noktası (PoC): En yüksek işlem hacmine sahip fiyat - alıcılar ve satıcıların en aktif olduğu piyasa uzlaşısını temsil eder ⚖️
- Delta: Her seviyedeki alım ve satım baskısı arasındaki fark 🔄
- Isı Haritası: Aktivite yoğunluğunun görselleştirilmesi 🔥
Mantık: Fiyat genellikle PoC'ye geri döner çünkü en çok bekleyen likidite orada bulunur. Fiyat PoC'den uzaksa, geri dönüş olasılığı daha yüksektir 🔄
Modül 2: İstatistiksel Projeksiyon (Monte Carlo) 🎲
Gelecekteki fiyatı projekte etmek için stokastik simülasyonlar kullanır (varsayılan olarak 1.000 iterasyon):
- Varlığın tarihsel trendini ve yıllık volatilitesini hesaplar 📉📈
- Normal dağılım kullanarak rastgele yollar üretir (geometrik Brown hareket modeli) 🌊
- Beklenen Değeri standart sapma bantlarıyla (±1 sigma) tahmin eder 📏
Uygulanan formül: - Bar başına sürüklenme = Yıllık getiri / işlem günleri 🧮
- Bar başına volatilite = Yıllık volatilite / √günler ⚡
- Projeksiyon = Güncel fiyat × e^(toplam sürüklenme + normal rastgele × toplam volatilite) 🔢
Modül 3: Sinerji 🔗
Her iki analizi birleştirerek bağlamsal sinyaller üretir:
Tablo
Sinyal Koşulu Anlamı
BOĞA ↑ 🟢 Fiyat > PoC + Pozitif projeksiyon Hacimle doğrulanmış boğa trendi
AYAĞI ↓ 🔴 Fiyat < PoC + Negatif projeksiyon Hacimle doğrulanmış ayı trendi
FIRSAT ★ 💡 Fiyat < PoC + Pozitif projeksiyon Hacim desteğinden olası sıçrama
UYUMSUZLUK ⚠️ ⚠️ Fiyat > PoC + Negatif projeksiyon Olası dönüş uyarısı
📈 NE İÇİN KULLANILIR?
✅ Ana hacim seviyelerini belirlemek - PoC fiyat mıknatısı görevi görür 🧲
✅ Başarı olasılıklarını tahmin etmek - Simülasyondaki kazanma senaryolarının yüzdesi 🏆
✅ Risk/ödül değerlendirmesi yapmak - Projeksiyon Sharpe oranı ve standart sapma 📊
✅ İşlem yönünü onaylamak - PoC'ye göre pozisyon ve istatistiksel momentum arasındaki sinerji 🎯
✅ Hedef projeksiyonu - Tanımlı tutma dönemi için beklenen fiyat seviyeleri 🎯
🎮 KONFİGÜRASYON VE KULLANIM
Ana Parametreler:
Tablo
Grup Parametre Varsayılan Açıklama
Derinlik Profili Analiz Süresi 200 bar Hacim profilini hesaplamak için geçmiş
Fiyat Seviyeleri 30 Profil çözünürlüğü (daha fazla seviye = daha fazla detay) 🔍
Yatay Ofset 5 Grafikte profil pozisyonu 📏
İstatistiksel Projeksiyon Maks İşlem Süresi 252 bar Projeksiyonun zaman ufku ⏱️
Yatırılan Sermaye $1,000 Parasal hesaplamalar için temel 💰
Simülasyonlar 1,000 Rastgele yolların sayısı (daha fazla = daha doğru, daha yavaş) 🔄
Risksiz Getiri Oranı %5 Sharpe Oranı hesaplaması için 📉
Tarihsel Strateji TP/SL Kullanımı Hayır Sabit hedeflerle simülasyon yapmak için etkinleştir 🎯
Sonuçları Yorumlama Tablosu:
düz
Kopyala
BEKLENEN DEĞER İSTATİSTİKLERİ
┌──────────────┬─────────┬─────────┬─────────┬────────┐
│ Yöntem │ $ Tutar│ % Getiri│ Kazanma Oranı│ Sharpe │
├──────────────┼─────────┼─────────┼─────────┼────────┤
│ Tarihsel │ -$19.56 │ -1.96% │ %47.2 │ -1.24 │
│ Simülasyon │ -$54.05 │ -5.40% │ %21.4 │ -4.95 │
└──────────────┴─────────┴─────────┴─────────┴────────┘
- Tarihsel: Benzer geçmiş işlemlerin ortalama performansı 📜
- Simülasyon: 1.000 Monte Carlo simülasyonunun ortalama sonucu 🎲
- Kazanma Oranı: Pozitif sonuçlu senaryoların yüzdesi ✅
- Sharpe: Risk ayarlı getiri (1'den büyük iyi, negatif kötü) 📈
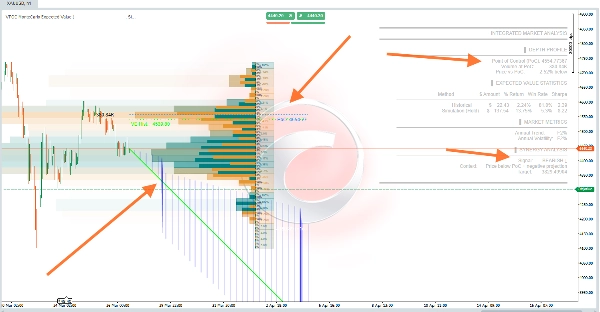
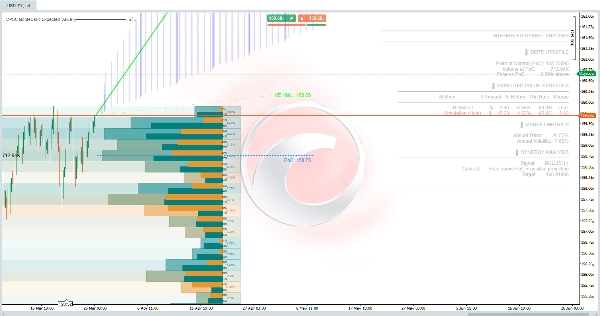
🖼️ Grafikte Görsel Öğeler
Tablo
Öğe Renk Anlam
Hacim profili Turuncu/mavi gradyan Fiyat seviyesine göre aktivite yoğunluğu 🎨
PoC çizgisi Mavi noktalı Geleceğe projekte edilmiş Kontrol Noktası 🔵
EV projeksiyon çizgisi Yeşil/Mor Beklenen fiyat trajektorisi 🟢🔴
±1σ bandı Beyaz noktalı çizgiler %68 güven aralığı 📊
Tarihsel EV çizgisi Yeşil noktalı Tarihsel verilere dayalı beklenen değer 🟢
Projeksiyon bölgesi Saydam mavi dolgu Bantlar arasındaki olasılık alanı 🔵
⚠️ ÖNEMLİ - Sınırlamalar
- Al/Sat sinyali değildir - Olasılıksal bir analiz aracıdır 🛠️
- Monte Carlo simülasyonları tarihsel dağılımın geçerli olduğunu varsayar (kara kuğu olaylarını tahmin etmez) 🦢❌
- PoC dinamiktir - Her yeni barda yeniden hesaplanır 🔄
- Yeterli geçmiş gerektirir - Güvenilir projeksiyonlar için minimum 252 bar 📊
- Kripto paralar - Gösterge otomatik olarak 365 yıllık işlem gününe ayarlanır, geleneksel piyasalar için 252 yerine 🪙
💡 Önerilen Kullanım Stratejisi
- FIRSAT ★ 💡 Ara - Fiyat PoC'nin altında ama pozitif projeksiyon var (olası düşük değerleme)
- Kazanma Oranı > %50 ile onayla - Daha yüksek istatistiksel başarı olasılığı ✅
- UYUMSUZLUK ⚠️ ⚠️'dan kaçın - Gerçek hacme göre aşırı değerlenmiş fiyat
- Referans olarak PoC'yi kullan - Bu likidite seviyesi etrafında durdurma veya hedefler 🎯
- Tarihsel ile Simülasyonu karşılaştır - Çok farklılarsa piyasa rejimi değişiyor demektir 🔄


