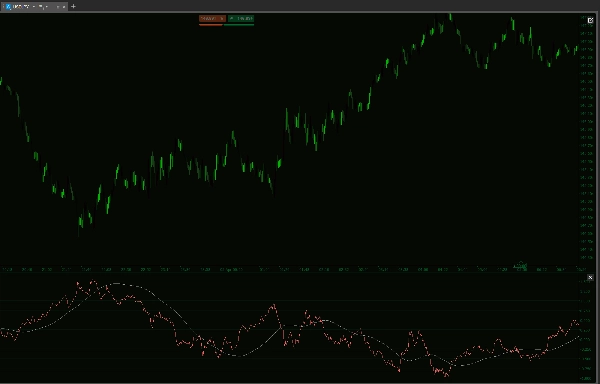
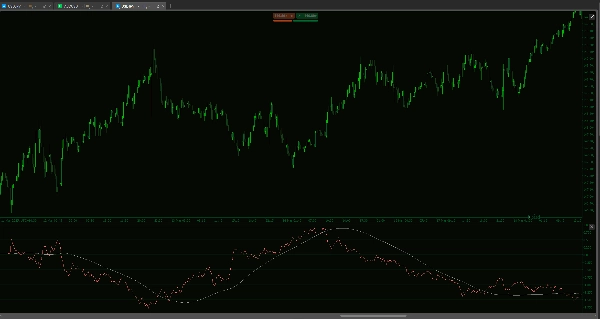
شعار "Yen Index w HMA"
Yen Index w HMA
صورة "Yen Index w HMA" المحملة
منذ 14/01/2025
46
المبيعات
9.67K
التثبيتات المجانية

Introducing the Historical JXY Yen Index Indicator – the ultimate tool for gauging the strength of the Japanese Yen against major currencies. This advanced cTrader indicator synthesizes data from six key Yen pairs (EURJPY, GBPJPY, AUDJPY, NZDJPY, CADJPY, USDJPY) with customizable weightings to deliver a comprehensive, real-time picture of Yen performance.

Key Features:

  • Comprehensive Currency Blend:
    Integrates six pivotal Yen pairs, each weighted to reflect their market impact. The inverted percentage change mechanism ensures that as a pair strengthens against the Yen, its contribution accurately signals the Yen’s overall performance.
  • Multi-Layered Trend Analysis:
    Benefit from a suite of smoothing tools including an optional SMA and dual Hull Moving Averages (short and long term) that filter out noise and highlight true market trends, giving you the clarity to make confident trading decisions.
  • Customizable & Robust:
    Adjust parameters like the candle lookback count, weightings, and moving average periods to tailor the indicator to your unique trading style. Optional session resets keep your analysis fresh and aligned with the start of new trading sessions.
  • Actionable Insights:
    Whether you're tracking subtle shifts or major trends, the Historical JXY Indicator provides the actionable insights you need to capitalize on the momentum of the Yen.

Elevate your trading strategy with this cutting-edge technical tool. Harness the power of the Historical JXY Yen Index Indicator and turn complex market data into clear, strategic trading opportunities.


--------------------------

Please feel free to check out my other indicators!

https://ctrader.com/products/1181

https://ctrader.com/products/1182

https://ctrader.com/products/1180

https://ctrader.com/products/1015

https://ctrader.com/products/555

https://ctrader.com/products/553

https://ctrader.com/products/554

https://ctrader.com/products/552

https://ctrader.com/products/557

https://ctrader.com/products/845

https://ctrader.com/products/848

https://ctrader.com/products/847

https://ctrader.com/products/846

https://ctrader.com/products/551

https://ctrader.com/products/574

https://ctrader.com/products/573

https://ctrader.com/products/556

https://ctrader.com/products/558

https://ctrader.com/products/559

https://ctrader.com/products/560


Indicator profile
0.0
التقييمات: 0
تقييمات العملاء
لا توجد تقييمات لهذا المنتج حتى الآن. هل جرَّبته بالفعل؟ كن أول من يخبر الآخرين!
Forex
Indices
USDJPY
Products available through cTrader Store, including trading bots, indicators and plugins, are provided by third-party developers and made available for informational and technical access purposes only. cTrader Store is not a broker and does not provide investment advice, personal recommendations or any guarantee of future performance.

المزيد من هذا المؤلف

Track major trading sessions (Tokyo, London, New York) with customizable colors and visual sessions on your chart.
Auto-detect supply & demand zones, remove broken levels, and trade smarter with real-time alerts. Precision made simple.
Market Session V2: Full Control. colors, history, session/text toggles, font size. Elevate your strategy!
Version 3: Full control of session display including start and end times of all 3 sessions!
Supply and demand zones. They're important. Here's a free version to get you started!
The Multi-Timeframe Candle Indicator displays candles from multiple timeframes in one window, enhancing market analysis!
VWAP Set to London Open
The Advanced Volume Profile Indicator calculates POC, Median, and Mode, revealing key price levels for smarter trading.
VWAP Set to Tokyo Open
RCS: 8 majors! AUD,USD,EUR,JPY,GBP,CAD,CHF,NZD. Find how strong each currency is relatively and trade smarter!
US Dollar Index
Stay ahead with a real-time countdown to candle closes on all key timeframes: 5m, 15m, 30m, 1H, 4H, and Daily.

قد يعجبك أيضًا

Session Volume Profile is a professional volume profile indicator for cTrader.
TSPivotSMC-V2: The Fusion of Classical Pivots & Institutional Liquidity.
شعار "MACD Plus"
5.0
(2)
مجاني
A visually enhanced MACD with colored histograms to clearly show trend strength.
Auto Trendlines, Fibonacci, Pitchfork and Patterns from non‑repainting pivots. One‑click Presets, targeted Alerts, and a
TECHNICAL ANALYSIS, WITH SOUND ALERT
BB Breakout Oscillator with alerts! Spot trend reversals using Bollinger Bands. Bullish/Bearish crossovers Alerts.
Draw a rectangle, label it RRL or RRS. Instant position size, risk, reward targets and full R:R breakdown.
Daily High & Low with live Percentage change.
The ZigZag Trend is a market structure tool that filters out small price fluctuations and highlights major swing.
Bring the RMA to cTrader! This is the Relative Moving Average from TradingView.
Custom your Renko Brick how do you wish!
Automatically calculates the previous day’s high and low, determines the range, and then projects Fibonacci levels.
Pinpoint FVGs, track fills and see mitigation stats — trade imbalances with clarity and confidence.
Utilize support and resistance levels across various timeframes, including large, range, and tick charts
Multi-symbol Inside Bar Scanner with dashboard & breakout alerts
Custom and native timeframes display with OHLC lines, moving averages, and Fibonacci levels.
Basic & FREE. Plots New York Initial Balance (NY local time) and projects IB High, IB Low, and midline.
The Parabolic SAR, or "Stop and Reverse," is a dynamic technical analysis tool.
منذ 14/01/2025
46
المبيعات
9.67K
التثبيتات المجانية