


Mô tả
Tổng quan
MarketStructurePro là một chỉ báo phát hiện swing chuyên nghiệp tự động xác định và phân loại các điểm quay quan trọng của thị trường bằng cách sử dụng phân tích fractal. Nó làm nổi bật bốn loại swing thiết yếu: Đỉnh Cao Hơn (HH), Đáy Cao Hơn (HL), Đỉnh Thấp Hơn (LH), và Đáy Thấp Hơn (LL).
Hoạt động trên tất cả các công cụ (Forex, Crypto, Chỉ số, Hàng hóa) và khung thời gian.
Cách hoạt động
Chỉ báo phân tích dữ liệu hành động giá (Cao, Thấp, Đóng) để phát hiện các điểm swing quan trọng bằng toán học fractal. Nó đánh giá các đỉnh và đáy cục bộ, so sánh các swing liên tiếp để xác định hướng xu hướng, và nhận biết sự thay đổi cấu trúc thị trường khi các mẫu swing thay đổi.
Hoạt động hiệu quả trong:
- Thị trường có xu hướng - xác định các mẫu tiếp diễn
- Thị trường dao động trong biên độ - xác định mức hỗ trợ/kháng cự
- Thị trường biến động mạnh - làm nổi bật các điểm quay quan trọng
- Tất cả các khung thời gian - từ biểu đồ 1 phút đến hàng tháng
Diễn giải tín hiệu
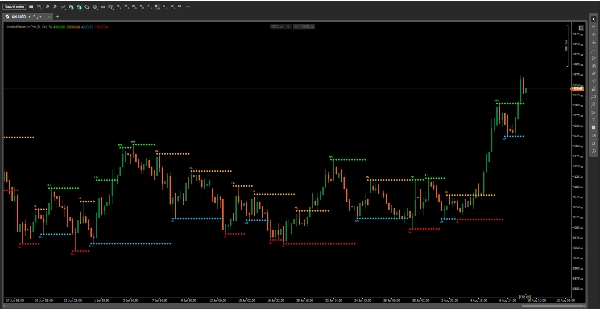
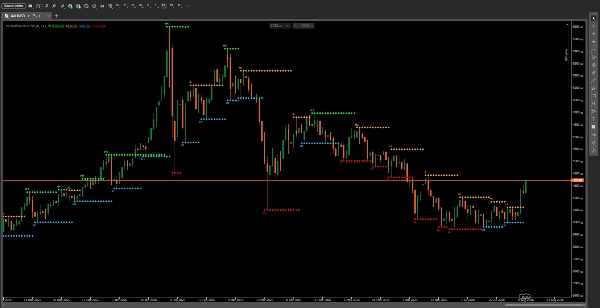
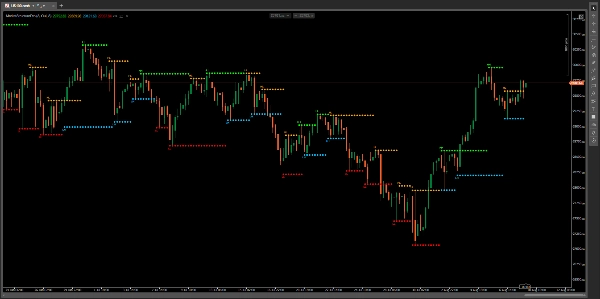
Chỉ báo hiển thị 4 điểm được mã màu trực tiếp trên biểu đồ của bạn:
Đỉnh Cao Hơn (HH) - Xanh Chanh
Một đỉnh mới cao hơn đỉnh trước đó. Cho thấy sự tiếp diễn tăng giá và xu hướng tăng đang mạnh lên.
Đáy Cao Hơn (HL) - Cam
Một đáy mới cao hơn đáy trước đó. Cho thấy cấu trúc tăng giá với hỗ trợ đang dịch chuyển lên.
Đỉnh Thấp Hơn (LH) - Xanh Da Trời Đậm
Một đỉnh mới thấp hơn đỉnh trước đó. Cho thấy cấu trúc giảm giá với kháng cự đang dịch chuyển xuống.
Đáy Thấp Hơn (LL) - Đỏ
Một đáy mới thấp hơn đáy trước đó. Cho thấy sự tiếp diễn giảm giá và xu hướng giảm đang mạnh lên.
Đọc cấu trúc thị trường:
- HH + HL tăng = Xu hướng tăng mạnh
- LH + LL giảm = Xu hướng giảm mạnh
- HH thất bại theo sau là LH = Tiềm năng đảo chiều giảm
- LL thất bại theo sau là HL = Tiềm năng đảo chiều tăng
Cài đặt chính
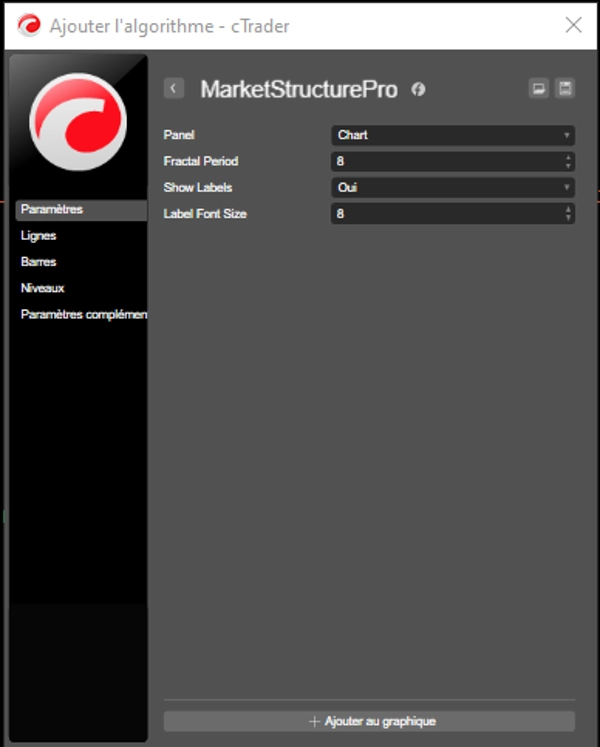
Chu kỳ Fractal (Mặc định: 8)
Số lượng nến được sử dụng để xác định các điểm swing. Giá trị cao hơn tạo ra ít swing hơn nhưng quan trọng hơn. Giá trị thấp hơn tạo ra nhiều tín hiệu hơn để phát hiện sớm hơn.
Hiển thị nhãn (Mặc định: True)
Bật hoặc tắt nhãn văn bản (HH/HL/LH/LL) để biểu đồ gọn gàng hơn.
Kích thước phông chữ nhãn (Mặc định: 8)
Điều chỉnh kích thước nhãn swing để dễ nhìn hơn.
Các chu kỳ đề xuất:
- Chu kỳ 5-7: Giao dịch trong ngày và scalping
- Chu kỳ 8-12: Giao dịch swing
- Chu kỳ 14-20: Giao dịch vị thế
Kịch bản giao dịch
Theo xu hướng
Xác định xu hướng hiện tại bằng các mẫu HH/HL hoặc LH/LL. Vào lệnh khi giá hồi về HL (xu hướng tăng) hoặc LH (xu hướng giảm). Đặt stop loss dưới HL cuối cùng hoặc trên LH cuối cùng. Mục tiêu là HH hoặc LL tiếp theo.
Giao dịch phá vỡ
Quan sát giá tiếp cận HH hoặc LL trước đó. Vào lệnh khi giá phá vỡ trên HH (mua) hoặc dưới LL (bán). Đặt stop loss dưới nến phá vỡ hoặc điểm swing gần nhất.
Phát hiện đảo chiều
Theo dõi các phá vỡ thất bại. HH theo sau là LH cho thấy tiềm năng đảo chiều giảm. LL theo sau là HL cho thấy tiềm năng đảo chiều tăng.
Hỗ trợ & Kháng cự
Sử dụng HH và LL làm các mức chính. Vẽ các đường ngang cho điểm vào và thoát lệnh. Mua tại hỗ trợ HL, bán tại kháng cự LH.
Khái niệm Tiền Thông Minh (SMC)
Xác định Phá vỡ Cấu trúc (BoS) và Thay đổi Tính cách (ChoCh). Vào lệnh khi cấu trúc bị phá vỡ với stop loss vượt qua điểm swing cuối cùng.
Dành cho ai?
Hoàn hảo cho:
- Nhà giao dịch Price Action
- Nhà giao dịch SMC (Khái niệm Tiền Thông Minh)
- Người theo xu hướng
- Nhà giao dịch swing
- Nhà giao dịch trong ngày
Trình độ kinh nghiệm:
Phù hợp cho mọi trình độ - từ người mới đến nâng cao. Trực quan và dễ hiểu cho người mới trong khi cung cấp phân tích cấu trúc chuyên nghiệp cho nhà giao dịch có kinh nghiệm.
Hạn chế quan trọng
Chỉ báo trễ
Fractal được xác định sau khi hình thành, cần xác nhận 2 nến. Tín hiệu phản ứng, không dự đoán.
Hiệu quả thấp hơn trong thị trường dao động
Có thể tạo ra nhiều tín hiệu trong điều kiện đi ngang. Sử dụng chu kỳ fractal cao hơn để giảm nhiễu.
Có thể bỏ lỡ các biến động mạnh
Biến động cực đoan có thể tạo ra các swing vượt qua phát hiện fractal.
Ghi chú sử dụng:
- Luôn sử dụng kết hợp với các chỉ báo khác
- Cấu trúc khung thời gian cao hơn có ý nghĩa hơn
- Không phải mọi điểm swing đều là tín hiệu giao dịch
- Điều chỉnh chu kỳ dựa trên biến động thị trường
- Luôn kiểm tra lại trước
Tuyên bố từ chối trách nhiệm
Hiệu suất trong quá khứ không đảm bảo kết quả tương lai. Chỉ báo này là công cụ hỗ trợ phân tích, không phải hệ thống giao dịch. Luôn quản lý rủi ro phù hợp. Giao dịch có rủi ro cao. Tham khảo ý kiến cố vấn tài chính trước khi đưa ra quyết định giao dịch.
Sẵn sàng làm chủ cấu trúc thị trường?
MarketStructurePro biến hành động giá phức tạp thành các tín hiệu rõ ràng, có thể hành động. Tải ngay và nhìn thấy cấu trúc thị trường rõ ràng!
Thẻ
Cấu trúc Thị trường, SMC, Swing, Fractal, Hành động Giá, Tiền Thông Minh, Xu hướng
Tóm tắt
The indicator displays color-coded points on the chart—lime green for HH, orange for HL, deep sky blue for LH, and red for LL—helping traders interpret market trends, potential reversals, and support/resistance levels. It supports various trading scenarios such as trend following, breakout trading, reversal detection, and SMC strategies by identifying Break of Structure (BoS) and Change of Character (ChoCh).
Key settings include adjustable fractal periods to control signal sensitivity and label display options. MarketStructurePro is suitable for all experience levels and trading styles, including price action, swing, and day trading. It is a reactive tool that requires confirmation and should be used alongside other indicators for comprehensive analysis.
















![Logo "[Hamster-Coder] Pivot Points MTF"](https://cdn.ctrader.com/image/webp/4c143e5a-309c-40e3-a578-f04d1e133ffa_31159)











