
Drawing Utility
Indikator
208 muat turun
Versi 1.0, Jul 2025
Windows, Mac
Penerangan
Alt + Seret untuk mengaktifkannya pada carta anda.
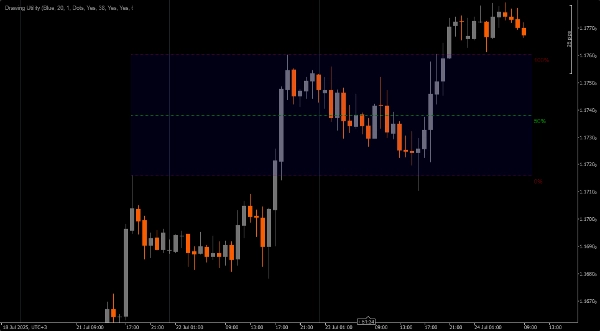
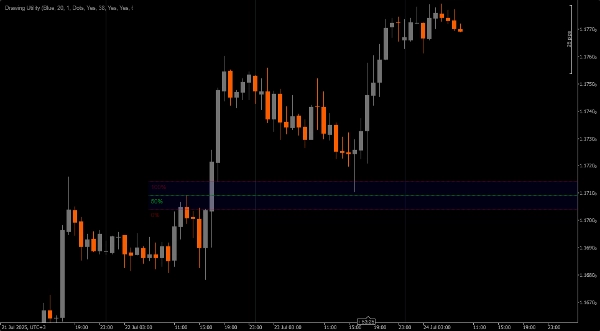
Utiliti lukisan yang boleh disesuaikan.
1. Akses pantas Fibonacci.
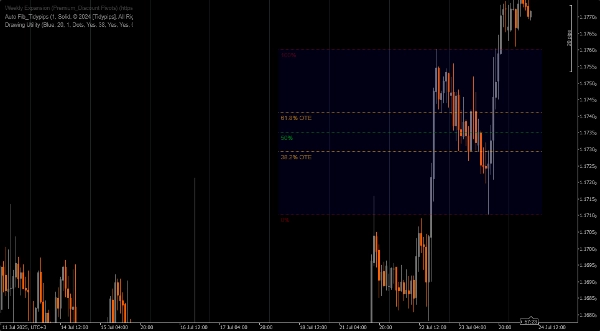
2. Penanda Jurang Nilai Adil
3. Alat pengukuran
4. Penanda Titik Kepentingan
5. atau kegunaan lain (yang saya belum fikirkan) yang anda mungkin anggap sesuai untuk memberi anotasi pada carta anda
NOTA **Alt + Seret untuk mengaktifkannya pada carta anda.**
Ringkasan
Ringkasan AI
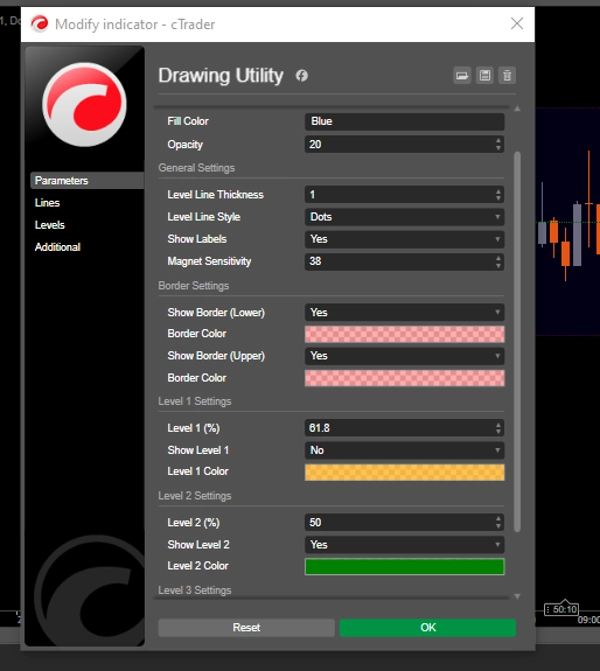
Drawing Utility is a customizable chart annotation tool designed for trading platforms. It features a rectangular box with five adjustable Fibonacci levels, which can also be customized to user-defined values. The utility is activated by pressing Alt and dragging on the chart. Key functionalities include quick access to Fibonacci retracement levels, marking Fair Value Gaps, measuring price movements, and highlighting Points of Interest. Additionally, it supports flexible use cases for various chart annotations, allowing traders to tailor it to their specific analysis needs.
Profil indikator
Ulasan pelanggan
0.0
Ulasan: 0
Ulasan pelanggan
Belum ada ulasan untuk produk ini. Anda sudah mencuba produk tersebut? Jadilah yang pertama untuk berkongsi pendapat anda!
Perbincangan
Soalan Lazim
Produk yang tersedia melalui cTrader Store, termasuk bot dagangan, indikator dan plugin, disediakan oleh pembangun pihak ketiga dan diberikan akses untuk tujuan maklumat dan teknikal sahaja. cTrader Store bukan broker dan tidak memberikan nasihat pelaburan, syor peribadi atau sebarang jaminan prestasi masa hadapan.
Lebih banyak produk daripada penulis ini


Harga
15
Jualan
4.62K
Pemasangan percuma