Penerangan
📈 Penunjuk Divergency v1.1 untuk cTrader: Panduan Komprehensif 🚀
Penunjuk Divergency v1.1 adalah alat yang kuat direka untuk platform cTrader bagi mengenal pasti divergensi dan korelasi antara tindakan harga dan pelbagai osilator. Panduan ini menyediakan penerangan terperinci tentang kod, fungsinya, dan arahan langkah demi langkah tentang cara menggunakannya dengan berkesan. Sama ada anda seorang pemula atau pedagang berpengalaman, penunjuk ini boleh meningkatkan analisis teknikal anda dengan tetapan yang boleh disesuaikan dan petunjuk visual. Mari kita mulakan! 🌟
🎯 Gambaran Keseluruhan Penunjuk Divergency11
Penunjuk Divergency v1.1 menganalisis pergerakan harga dan tingkah laku osilator untuk mengesan:
- Divergensi Biasa: Menandakan kemungkinan pembalikan apabila harga dan penunjuk bergerak ke arah bertentangan.
- Divergensi Tersembunyi: Menunjukkan kesinambungan tren apabila harga dan penunjuk selari secara berbeza.
- Korelasi: Menonjolkan apabila harga dan penunjuk bergerak serentak, mencadangkan kekuatan tren.
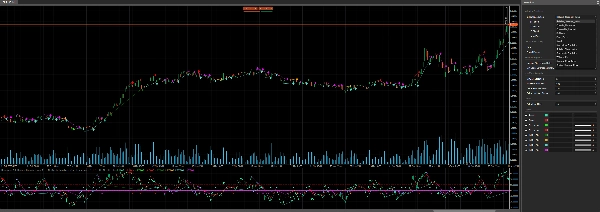
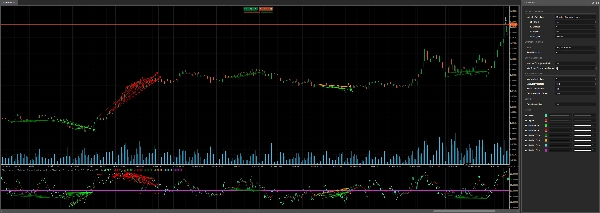
Ia menyokong 12 osilator berbeza (contohnya, RSI, MACD, Stochastic) dan membenarkan penyesuaian parameter pengesanan divergensi, menjadikannya serbaguna untuk pelbagai strategi perdagangan. Penunjuk ini memplot isyarat terus pada carta dan kawasan penunjuk, menggunakan garis berwarna, ikon, dan teks untuk visualisasi yang jelas. 📊
🔍 Pecahan Kod
1. Persediaan Penunjuk 🛠️
- Namespace dan Kelas: Ditakrifkan dalam
cAlgonamespace sebagaiDivergency v1.1, mewarisi dariIndicator. - Atribut:
-
IsOverlay = false: Dipaparkan dalam tetingkap penunjuk berasingan.TimeZone = TimeZones.UTC: Menggunakan UTC untuk konsistensi.AccessRights = AccessRights.None: Tiada kebenaran khas diperlukan.
2. Parameter ⚙️
Penunjuk menawarkan penyesuaian meluas melalui parameter, dikelompokkan untuk kejelasan:
- Pemilihan Osilator:
-
IndicatorSelection: Pilih dari 12 osilator (contohnya, RSI, MACD, Stochastic).(Dinormalisasi ke 50 sebagai tengah, dan hasil lebih tinggi untuk proses pengoptimuman)Value1,Value2,Value3: Laraskan tempoh, pelicinan, dan tetapan garis isyarat.MaType: Pilih jenis purata bergerak (contohnya, Mudah, Eksponen).
- Tetapan Divergensi:
-
Strat: Pilih mod pengesanan (Divergensi, Divergensi Tersembunyi, Korelasi, atau gabungan).PeriodFractal: Tetapkan tempoh fraktal untuk mengenal pasti puncak/lekuk (mesti ganjil).LookBack: Bilangan divergensi sejarah untuk dianalisis.MinCountDivergenceShow: Minimum divergensi diperlukan untuk memaparkan isyarat.
- Analisis Zon:
-
MinBarsValidation,MaxBarsValidation: Tetapkan julat bar sah untuk pengesanan divergensi.ExtraLevelMin,ExtraLevelMax: Tetapkan ambang osilator terlebih beli/terlebih jual.
- Tahap:
-
ExtraLevelLine: Laraskan garis terlebih jual/terlebih beli sekitar tahap 50.
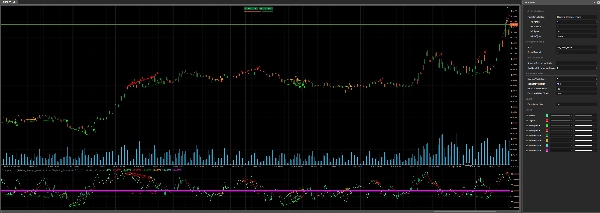
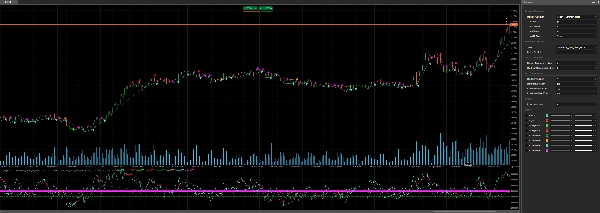
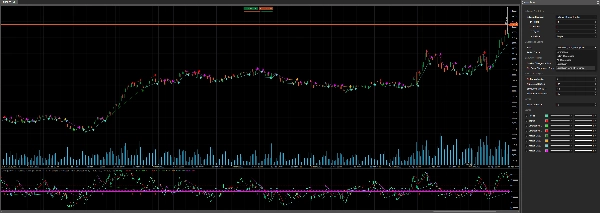
3. Output 📈
Result: Nilai utama osilator (garis hijau).Signal: Garis isyarat yang dilicinkan (garis merah).- Isyarat divergensi (dipaparkan sebagai titik):
-
ResDivergenceUp(Lime),ResDivergenceDown(Merah): Divergensi biasa.ResDivergenceUpHidden(Hijau),ResDivergenceDownHidden(Oren): Divergensi tersembunyi.ResCorrelationUp(Turquoise),ResCorrelationDown(Magenta): Korelasi.
4. Fungsi Utama 🧠
- Initialize(): Menyediakan penunjuk, mengesahkan parameter, dan melukis garis statik (terlebih jual, terlebih beli, sifar).
- Calculate(): Mengira nilai osilator, menormalkannya sekitar 50, dan mengesan fraktal untuk analisis divergensi.
- GetFractal(): Mengenal pasti puncak (fractalUp) dan lekuk (fractalDown) dalam osilator.
- GetDivergence(): Menganalisis titik fraktal untuk mengesan divergensi atau korelasi.
- CreateLine(): Melukis garis tren dan ikon untuk isyarat yang dikesan.
- DawDivergence(): Memvisualisasikan divergensi dengan garis dan anak panah pada carta dan kawasan penunjuk.
5. Kelas Pembantu 📋
SRPrice: Menyimpan data fraktal (indeks, harga, nilai penunjuk).DivergenceFind: Menjejaki butiran divergensi (tajuk, masa, harga, warna).
6. Pengendalian Ralat 🚨
Penunjuk memeriksa parameter tidak sah (contohnya, MinBarsValidation > MaxBarsValidation, ganjil PeriodFractal) dan memaparkan amaran di kawasan penunjuk menggunakan DrawStaticText.
🛠️ Cara Menggunakan Penunjuk Divergency11
Langkah 1: Pemasangan 📥
- Muat Turun Kod: Salin kod C# yang disediakan.
- Tambah ke cTrader:
-
- Buka cTrader dan navigasi ke cAlgo > Indicators.
- Klik New dan tampal kod ke dalam editor.
- Bina penunjuk (pastikan tiada ralat kompilasi).
- Guna pada Carta:
-
- Buka carta dalam cTrader.
- Tambah penunjuk Divergency11 dari senarai penunjuk.
Langkah 2: Konfigurasikan Parameter ⚙️
Sesuaikan tetapan mengikut gaya perdagangan anda:
- Pilih Osilator:
-
- Pilih osilator (contohnya,
Relative_Strenght_Indexuntuk RSI) melaluiIndicatorSelection. - Laraskan
Value1(tempoh),Value2(pelicinan), danValue3(tempoh isyarat) mengikut keperluan.
- Pilih osilator (contohnya,
- Tetapkan Jenis Divergensi:
-
- Gunakan
Stratuntuk fokus padaDivergence,Hiden_Divergence,Correlation, atauAll_Divergence.
- Gunakan
- Fraktal dan Lookback:
-
- Tetapkan
PeriodFractalke nombor ganjil (contohnya, 5) untuk simetri. - Laraskan
LookBackuntuk mengawal berapa banyak divergensi sejarah dianalisis.
- Tetapkan
- Zon dan Tahap:
-
- Konfigurasikan
ExtraLevelMindanExtraLevelMaxuntuk zon terlebih beli/terlebih jual. - Tetapkan
ExtraLevelLineuntuk melaraskan ambang visual.
- Konfigurasikan
Langkah 3: Tafsir Isyarat 📊
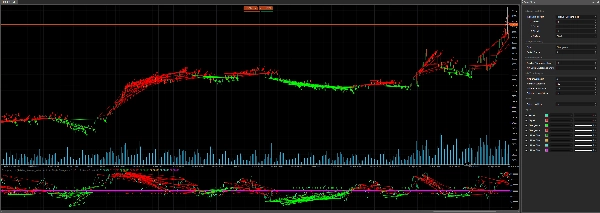
- Divergensi Biasa:
-
- Naik (Lime): Isyarat bearish (harga membuat tinggi lebih tinggi, osilator membuat tinggi lebih rendah).
- Turun (Merah): Isyarat bullish (harga membuat rendah lebih rendah, osilator membuat rendah lebih tinggi).
- Divergensi Tersembunyi:
-
- Naik (Hijau): Kesinambungan bullish (harga membuat tinggi lebih rendah, osilator membuat tinggi lebih tinggi).
- Turun (Oren): Kesinambungan bearish (harga membuat rendah lebih tinggi, osilator membuat rendah lebih rendah).
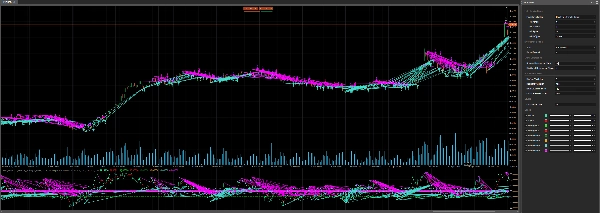
- Korelasi:
-
- Naik (Turquoise): Tren bullish kuat (harga dan osilator kedua-duanya meningkat).
- Turun (Magenta): Tren bearish kuat (harga dan osilator kedua-duanya menurun).
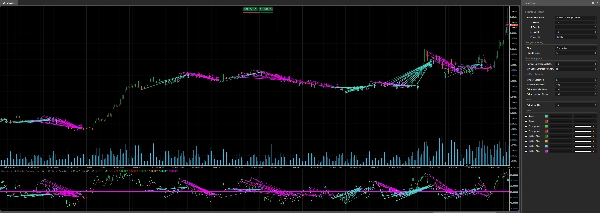
- Petunjuk Visual:
-
- Garis tren menghubungkan titik divergensi pada carta dan penunjuk.
- Anak panah menunjukkan arah isyarat (naik/turun).
- Teks memaparkan bilangan divergensi yang dikesan (jika
LookBack > 1).
Langkah 4: Strategi Perdagangan 💡
- Perdagangan Pembalikan:
-
- Gunakan divergensi biasa (Lime/Merah) untuk mengenal pasti kemungkinan pembalikan.
- Sahkan dengan penunjuk lain (contohnya, sokongan/rintangan, corak candlestick).
- Kesinambungan Tren:
-
- Divergensi tersembunyi (Hijau/Oren) menandakan kesinambungan tren.
- Masuk perdagangan mengikut arah tren selepas pullback.
- Kekuatan Tren:
-
- Korelasi (Turquoise/Magenta) mengesahkan tren kuat.
- Gunakan sebagai penapis untuk mengelakkan perdagangan bertentangan tren.
- Jangka Masa:
-
- Berfungsi pada mana-mana jangka masa, tetapi jangka masa lebih tinggi (H1, H4) mengurangkan bunyi.
- Pengurusan Risiko:
-
- Tetapkan stop-loss di bawah rendah ayunan terkini (untuk posisi panjang) atau di atas tinggi ayunan (untuk posisi pendek).
- Gunakan ATR (termasuk dalam kod) untuk menentukan saiz posisi.
Langkah 5: Pengoptimuman 🔧
- Ujian Semula: Gunakan ciri ujian semula cTrader untuk menguji penunjuk pada data sejarah.
- Laraskan Parameter: Cuba dengan
PeriodFractal,LookBack, danMinCountDivergenceShowuntuk mengurangkan isyarat palsu. - Gabungkan Penunjuk: Padankan dengan penunjuk tren (contohnya, Purata Bergerak) atau alat volatiliti (contohnya, Bollinger Bands).
🌟 Petua untuk Kejayaan
- Mulakan dengan Mudah: Mulakan dengan tetapan lalai dan osilator yang biasa seperti RSI.
- Berlatih pada Demo: Uji penunjuk pada akaun demo untuk memahami isyaratnya.
- Pantau Amaran: Perhatikan anak panah dan garis tren untuk bertindak balas dengan cepat terhadap isyarat.
- Elakkan Perdagangan Berlebihan: Gunakan divergensi sebagai sebahagian daripada strategi yang lebih luas, bukan secara berasingan.
- Sentiasa Dikemaskini: Semak kemas kini kod atau maklum balas komuniti di forum cTrader.
⚠️ Isu Biasa dan Penyelesaian
- Tiada Isyarat Muncul:
-
- Periksa
MinCountDivergenceShowberbandingLookBack(yang pertama mesti ≤ yang kedua). - Pastikan
PeriodFractaladalah ganjil.
- Periksa
- Terlalu Banyak Isyarat:
-
- Tingkatkan
MinCountDivergenceShowatau kurangkanLookBack. - Ketatkan
MinBarsValidationdanMaxBarsValidation.
- Tingkatkan
- Mesej Ralat:
-
- Semak amaran parameter di kawasan penunjuk (contohnya,
MinBarsValidation > MaxBarsValidation). - Betulkan tetapan tidak sah dan gunakan semula penunjuk.
- Semak amaran parameter di kawasan penunjuk (contohnya,
🎉 Kesimpulan
Penunjuk Divergency v1.1 adalah alat serbaguna dan kukuh untuk pengguna cTrader, menawarkan pandangan mendalam tentang hubungan harga-osilator. Dengan tetapan yang boleh disesuaikan dan output visual yang jelas, ia membolehkan pedagang mengenal pasti pembalikan, kesinambungan, dan kekuatan tren dengan yakin. Cuba ia, laraskan parameter, dan gabungkan ke dalam pelan perdagangan anda untuk meningkatkan analisis anda! 🚀
Selamat berdagang, dan semoga carta anda sentiasa hijau! 📈💚
Ringkasan
- Regular divergences signaling potential reversals when price and oscillator move oppositely.
- Hidden divergences indicating trend continuation with differing price and oscillator alignments.
- Correlations highlighting synchronized movements suggesting trend strength.
Signals are displayed on the chart and indicator window using colored lines, icons, and text for clarity. Visual cues include trend lines connecting divergence points and arrows indicating signal direction. Key functions handle initialization, calculation of normalized oscillator values, fractal detection, divergence analysis, and drawing of signals.
Users can configure overbought/oversold zones and adjust lookback periods to tailor signal sensitivity. The indicator works on any timeframe, with higher timeframes recommended to reduce noise. It includes error handling for invalid parameters and provides guidance for installation, parameter setup, signal interpretation, and trading strategies such as reversal and trend continuation. Backtesting and parameter optimization are supported within cTrader to refine performance.
Ulasan pelanggan
5 | 100 % | |
4 | 0 % | |
3 | 0 % | |
2 | 0 % | |
1 | 0 % |


![Logo "Smart Money Concepts (SMC) [Iridio Capital]"](https://cdn.ctrader.com/image/webp/28b69fd1-ef54-4bed-9487-07e78e883be4_40934)