
Beschreibung
Wie man mit der Donchian (Breakout) Strategie handelt
- Kaufen, wenn der Preis das N-Perioden-Hoch (Oben) durchbricht.
- Verkaufen, wenn der Preis das N-Perioden-Tief (Unten) durchbricht.
- Halten der Position, solange der Trend anhält; Ausstieg bei einem gegenteiligen Ausbruch oder über einen Trailing Stop.
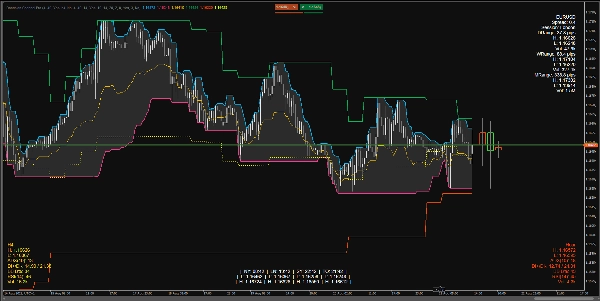
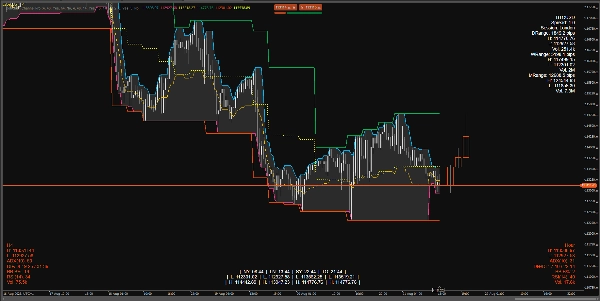
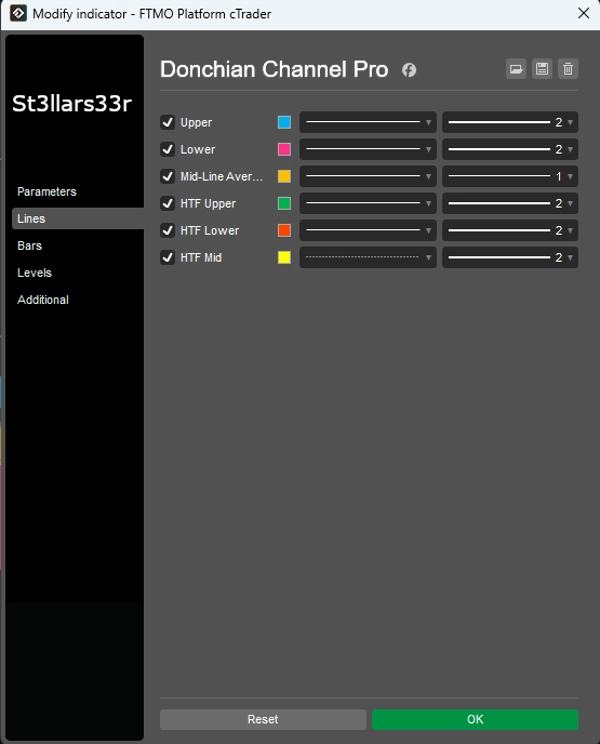
Was der Indikator im Chart zeigt
Donchian im aktuellen Zeitrahmen (TF):
- Oben: Der höchste Preis über die oberen Kanalbalken.
- Unten: Der niedrigste Preis über die unteren Kanalbalken.
- Mitte: Der Mittelpunkt zwischen Oben und Unten.
HTF Overlay: Donchian-Linien aus einem höheren Zeitrahmen, überlagert im Chart:
- HTF Oben, HTF Unten, HTF Mitte
- HTF Kerzen HUD: Rechtecke, die Kerzen des höheren Zeitrahmens darstellen, verankert rechts vom letzten Balken im aktuellen TF.
HUDs (Heads-Up Displays) unten/oben:
- Oben Rechts: Informationspanel für das Symbol + tägliche/wöchentliche/monatliche Spannen.
- Unten Links: HTF HUD (Metriken für den höheren Zeitrahmen).
- Unten Rechts: Mid TF HUD (Metriken für den mittleren Zeitrahmen).
- Unten Mitte: Sitzungsuhren + Hoch/Tief für jede Sitzung (persistent).
Was jedes HUD anzeigt
Oben Rechts (oben rechts)
- SymbolName
- Spread: Spread in Pips.
- Sitzung: Aktive aktuelle Sitzung (basierend auf angegebenen Stunden).
- DRange/WRange/MRange: Tages-/Wochen-/Monatsspanne in Pips.
- H/L/Vol: Hoch/Tief und Gesamtvolumen für den jeweiligen Zeitraum.
Unten Links (unten links) — HTF HUD
- TF Name (z.B. H4, D1, etc.)
- H/L: Aktuelles Hoch/Tief des letzten (oder aktiven) HTF-Balkens.
- ADX(n), DI+/DI-: Trendindikatoren.
- BB B%: Wo der aktuelle Preis relativ zu den Bollinger-Bändern im HTF liegt (0 nahe unterem Band, 100 nahe oberem Band).
- RSI(n)
- Vol: Volumen im HTF.
- HUD Farbe:
-
- Grün: Spanne erweitert sich nach oben (DI+ und ADX steigen).
- Rot: Zunehmender Abwärtsdruck (DI- steigt).
- Gelb: Neutral/undefiniert.
Unten Rechts (unten rechts) — Mid TF HUD
- Wie HTF HUD, aber für den mittleren Zeitrahmen (Mid Timeframe).
Unten Mitte (unten Mitte) — Uhren + Sitzungs H/L
- Zeit in NY, LN, SY, TO.
- L/H für jede Sitzung.
- Persistente Logik: Wenn eine Sitzung inaktiv ist, werden H/L der letzten abgeschlossenen Sitzung angezeigt; wenn eine neue Sitzung beginnt, werden Werte zurückgesetzt und neu berechnet.
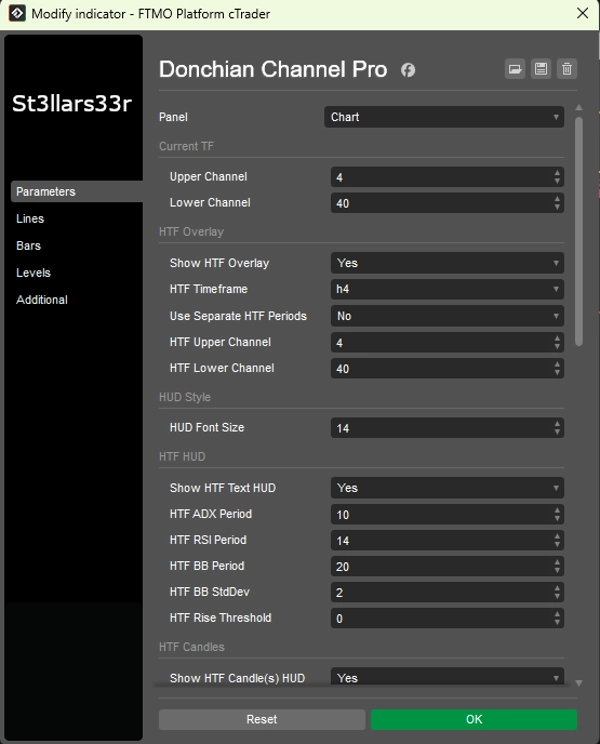
Parameter und deren Verwendung
Gruppe: Aktueller TF (Aktueller Donchian)
- Oberer Kanal: Anzahl der Balken für den oberen Kanal. Größerer Wert = selteneres Update, flachere Linie.
- Unterer Kanal: Anzahl der Balken für den unteren Kanal.
Gruppe: HTF Overlay (Donchian Overlay höherer Zeitrahmen)
- HTF Overlay anzeigen: Aktiviert HTF-Linien im Chart.
- HTF Zeitrahmen: Höheren Zeitrahmen auswählen (z.B. Hour4).
- Separate HTF Perioden verwenden: Wenn wahr, verwenden HTF Oben/Unten eigene Parameter; wenn falsch, werden aktuelle Oben/Unten verwendet.
- HTF Oberer Kanal: Länge des oberen Kanals für HTF.
- HTF Unterer Kanal: Länge des unteren Kanals für HTF.
Gruppe: HUD Stil
- HUD Schriftgröße: Schriftgröße für alle HUDs (Oben Rechts, Unten Links, Unten Rechts, Unten Mitte).
Gruppe: HTF HUD (Unten Links)
- HTF Text HUD anzeigen: Text-HUD für HTF anzeigen.
- HTF ADX Periode: ADX/DI Periode. Größer = glatter, weniger Rauschen, aber langsamere Reaktion.
- HTF RSI Periode: RSI Periode.
- HTF BB Periode: Bollinger-Bänder Periode.
- HTF BB StdDev: Standardabweichungs-Multiplikator für BB (klassisch ist 2,0).
- HTF Anstiegs-Schwelle: Empfindlichkeit gegenüber steigenden Metriken (beeinflusst HUD-Farbe).
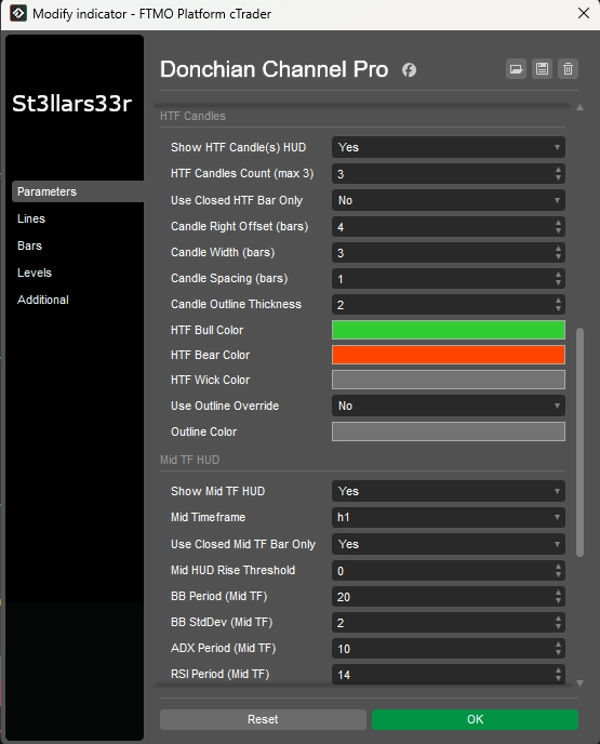
Gruppe: HTF Kerzen (Rechts, nahe letzter Balken)
- HTF Kerzen HUD anzeigen: HTF-Kerzen rechts anzeigen.
- Anzahl HTF Kerzen (max. 3): Anzahl der HTF-Kerzen (1–3).
- Nur geschlossene HTF-Balken verwenden: Wenn wahr, werden nur geschlossene HTF-Kerzen verwendet (stabile Werte). Wenn falsch, wird die aktuelle offene Kerze einbezogen.
- Kerzen-Rechtsversatz (Balken): Versatz nach rechts in Balken des aktuellen TF vom letzten Balken (Anker).
- Kerzenbreite (Balken): Breite des Kerzenrechtecks in aktuellen TF-Balken.
- Kerzenabstand (Balken): Abstand zwischen den Kerzen.
- Kerzenkontur-Dicke: Dicke der Kerzenkonturen.
- HTF Bull Farbe / HTF Bear Farbe: Farben für bullische/bärische Kerzen.
- HTF Docht Farbe: Farbe für Dochte.
- Kontur-Override verwenden: Wenn wahr, wird der Kerzenkörper mit einer Kontur (Konturfarbe) ohne Bull/Bear-Füllung gezeichnet.
- Konturfarbe: Farbe für Kontur, wenn Kontur-Override = wahr ist.
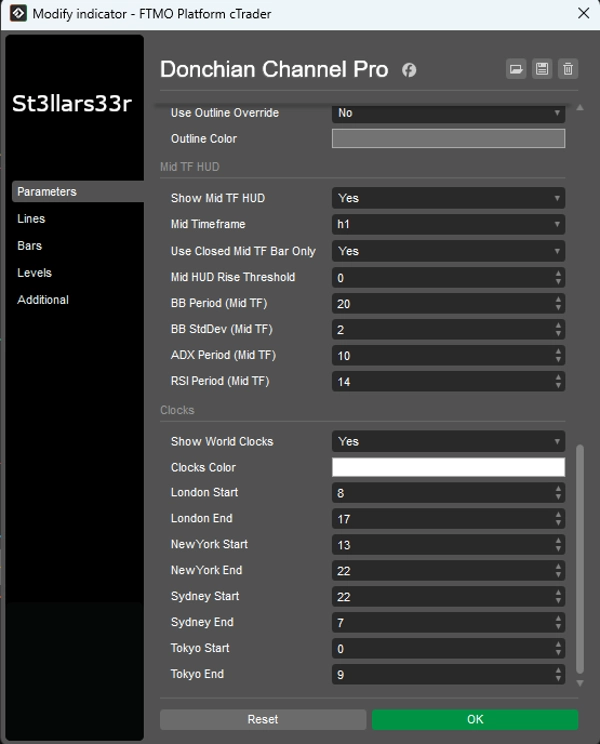
Gruppe: Mid TF HUD (Unten Rechts)
- Mid TF HUD anzeigen: Aktiviert HUD für den mittleren TF.
- Mittlerer Zeitrahmen: Mittleren TF auswählen (z.B. Minute15).
- Nur geschlossene Mid TF Balken verwenden: Wie bei HTF, aber für Mid TF.
- Mid HUD Anstiegs-Schwelle: Farbempfindlichkeit für Mid TF HUD.
- BB Periode (Mid TF), BB StdDev (Mid TF): Bollinger-Bänder Einstellungen für Mid TF.
- ADX Periode (Mid TF), RSI Periode (Mid TF): ADX- und RSI-Perioden für Mid TF.
Gruppe: Uhren (Unten Mitte)
- Weltuhren anzeigen: Block mit Uhren und Sitzungs H/L anzeigen.
- Uhrenfarbe: Textfarbe für Uhren/Sitzungen.
- London Start / London Ende: Start-/Endzeiten für die London-Sitzung.
- NewYork Start / NewYork Ende: Für New York.
- Sydney Start / Sydney Ende: Für Sydney.
- Tokyo Start / Tokyo Ende: Für Tokio.
Uhren: Zeigt die echte Ortszeit für Städte an (über Betriebssystem-Zeitzonen mit einem Fallback-Versatz).
- Berechnungen zur Sitzungsaktivität (und H/L) verwenden die Broker-Serverzeit (Server.Time). Wenn der Server nicht in UTC ist, können sich die Sitzungszeiten verschieben – passen Sie Start/Ende entsprechend Ihrem Server an.
- Wenn eine Sitzung Mitternacht überschreitet (Ende < Start), berücksichtigt der Indikator automatisch den Datumsübergang.
- Wenn eine Sitzung inaktiv ist, werden die H/L der letzten abgeschlossenen Sitzung angezeigt; wenn eine neue Sitzung beginnt, werden die Daten zurückgesetzt und neu berechnet.
Zusammenfassung
Kundenbewertungen
5 | 50 % | |
4 | 50 % | |
3 | 0 % | |
2 | 0 % | |
1 | 0 % |


