
Description
TIB — Indicateur Tick Imbalance Bars. Détectez les informations du marché avant les mouvements de prix
Version 2.0
Utilisez la section des commentaires pour demander plus de détails
Disponible pour une session vidéo avec guide d'installation après achat
Tick Imbalance Bars apporte une analyse de la microstructure du marché de qualité institutionnelle à cTrader. Basé sur les recherches révolutionnaires de Marcos López de Prado, détaillées dans son livre Advances in Financial Machine Learning, cet indicateur échantillonne les données de prix non pas par le temps ou le volume — mais par l'arrivée d'informations.
L'Insight Fondamental
Les barres traditionnelles (temps, tick, volume) échantillonnent les marchés de manière uniforme, manquant les moments critiques où les traders informés agissent. Tick Imbalance Bars résout ce problème en détectant quand la pression d'achat ou de vente dépasse les niveaux attendus — signalant la présence de traders informés et un mouvement potentiel des prix avant que le marché n'atteigne l'équilibre.
Comment ça fonctionne
L'indicateur applique la règle du tick pour classer chaque transaction comme pression d'achat (+1) ou de vente (-1). Il accumule ensuite ces ticks signés jusqu'à ce que le déséquilibre cumulatif (θT) dépasse un seuil dynamique calculé à l'aide d'une moyenne mobile exponentielle pondérée (EWMA). Ce seuil attendu s'adapte aux conditions du marché en analysant la probabilité historique des ticks d'achat par rapport aux ticks de vente. Lorsque le seuil est franchi, une nouvelle barre TIB est créée — chaque barre contenant des quantités approximativement égales d'informations de marché, indépendamment du volume ou du temps écoulé.
Caractéristiques clés
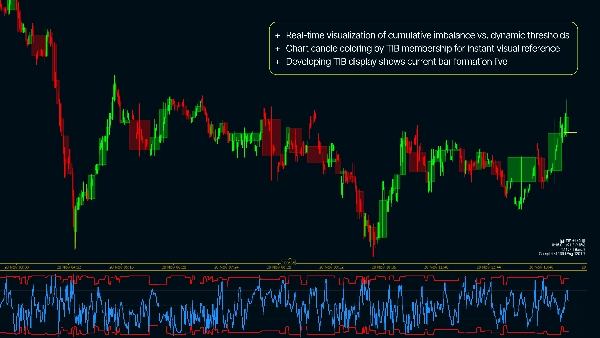
- Visualisation en temps réel du déséquilibre cumulatif par rapport aux seuils dynamiques
- Coloration des chandeliers du graphique par appartenance TIB pour une référence visuelle instantanée
- Affichage du TIB en développement montrant la formation en direct de la barre actuelle
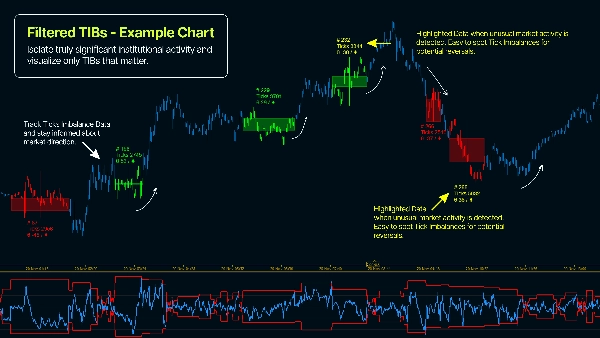
- Filtre Min Ticks pour afficher uniquement les barres statistiquement significatives
- Paramètres entièrement configurables de la taille de barre attendue et de l'EWMA
- Tableau de bord avec métriques suivant l'intensité du déséquilibre et la densité d'information
Pourquoi utiliser Tick Imbalance Bars ?
- Échantillonnez plus fréquemment pendant les périodes à haute information — capturant la volatilité exploitable
- Détectez l'activité de trading informé avant que l'équilibre des prix ne soit atteint
- Réduisez le bruit des participants non informés et du flux d'ordres de détail
- Obtenez de meilleures propriétés statistiques (retours IID de type gaussien) que l'échantillonnage basé sur le temps
- Appliquez une méthodologie quantitative éprouvée utilisée par les traders institutionnels
- Identifiez l'information asymétrique dans le flux d'ordres — un prédicteur avéré de la direction des prix
Guide pratique de configuration pour la configuration de base ( ! )
- Appliquez l'indicateur sur une unité de temps de 1 minute (ou inférieure - utilisez des graphiques basés sur les ticks)
- E[T] - Saisissez le nombre de ticks attendus par barre pour l'échantillonnage (commencez par 1000)
- EWMA Alpha - [0,001 - 0,5], où 0,001 produira les résultats les plus stables (en théorie) tandis que 0,5 produira des TIB basés sur des données plus récentes
- Déséquilibre initial - recommandé 0,5 mais vous pouvez expérimenter (0,5 = déséquilibre neutre à l'initialisation)
Résumé
The indicator classifies each trade as buying (+1) or selling (-1) pressure using the tick rule and accumulates these signed ticks until a dynamic threshold—calculated via an Exponentially Weighted Moving Average (EWMA)—is exceeded. When this threshold is breached, a new Tick Imbalance Bar (TIB) is formed, each containing roughly equal market information regardless of elapsed time or volume.
Key features include real-time visualization of cumulative imbalance versus dynamic thresholds, candle coloring by TIB membership, live display of the developing bar, a minimum ticks filter for statistical significance, configurable expected bar size and EWMA parameters, and dashboard metrics tracking imbalance intensity and information density.
This approach enables more frequent sampling during high-information periods, reduces noise from uninformed trades, and provides better statistical properties than time-based sampling. It supports markets including Forex, indices, and cryptocurrencies, and is suitable for strategies such as scalping and breakout trading.
Avis clients
5 | 100 % | |
4 | 0 % | |
3 | 0 % | |
2 | 0 % | |
1 | 0 % |


