present
Registrieren Sie sich und erhalten Sie $50 Rabatt auf Ihren ersten Kauf
Trading product for HEDGE FUND FX DESK RISK MANAGEMENT Indikator Drawdown Monitor Imbalance, image 1
HEDGE FUND FX DESK RISK MANAGEMENT
Indikator
Version 1.0, Aug 2026
Windows, Mac
5.0
Bewertungen: 1
Trading product for HEDGE FUND FX DESK RISK MANAGEMENT Indikator Drawdown Monitor Imbalance, image 2
Trading product for HEDGE FUND FX DESK RISK MANAGEMENT Indikator Drawdown Monitor Imbalance, image 3
Trading product for HEDGE FUND FX DESK RISK MANAGEMENT Indikator Drawdown Monitor Imbalance, image 4
Trading product for HEDGE FUND FX DESK RISK MANAGEMENT Indikator Drawdown Monitor Imbalance, image 5
Trading product for HEDGE FUND FX DESK RISK MANAGEMENT Indikator Drawdown Monitor Imbalance, image 6
51
Verkäufe
306
Kostenlose Installationen

Beschreibung

Willkommen bei der FX-DESK RISK MANAGEMENT HEATMAP. Liebe Trader, nachdem Sie diesen Indikator gekauft haben, werden Sie nicht mehr blind mit FX-PAIR CORRELATION handeln, sondern stattdessen in der Lage sein, ein ordnungsgemäß verwaltetes Orderbuch von Positionen zu führen, die perfekt gemäß der FX-Cross-Korrelation abgesichert sind.

Sehen Sie den Markt so, wie es ein professionelles FX-Desk tut.

Die meisten Trader eröffnen Positionen, ohne zu wissen, wie ihre Instrumente statistisch miteinander verbunden sind. Long EUR/USD zu sein, während man short USDX oder USD/CHF ist, mag wie zwei separate Trades aussehen – aber es ist oft dasselbe Risiko, das zweimal ausgedrückt wird. Nicht erkannte überlappende Exposition ist einer der häufigsten Gründe, warum Portfolios übermäßig gehebelt und „zufällig“ werden.

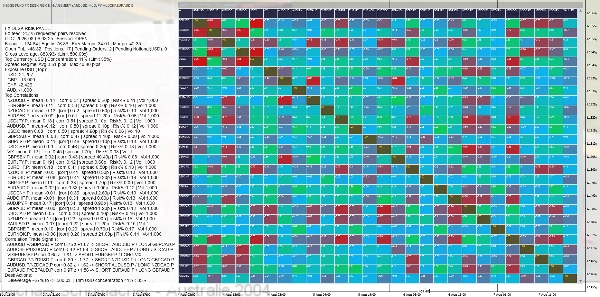
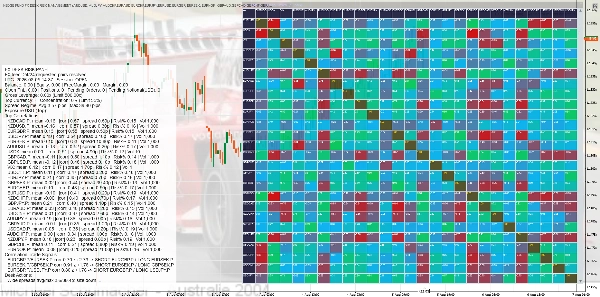
FX‑DESK RISK MANAGEMENT beseitigt diese Blindheit. Es berechnet kontinuierlich Kreuzkorrelationen über Ihr Instrumentsortiment und stellt diese in einer klaren, farbcodierten Heatmap dar, zusammen mit einem Live-Info-Panel, das Ihre tatsächlich offenen Positionen analysiert – sodass jeder Trade, den Sie platzieren, durch Daten und nicht durch Vermutungen gestützt wird.

Was Sie erhalten

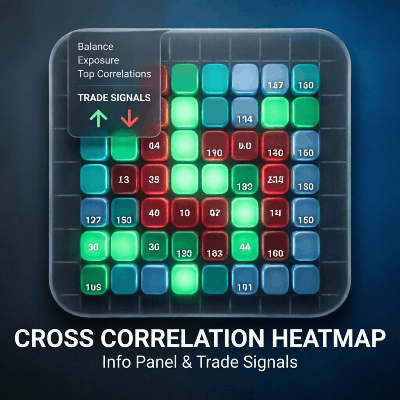
🔥 Live-Korrelations-Heatmap

  • Echtzeit-Kreuzkorrelationsmatrix für FX-Paare und darüber hinaus
  • Fügen Sie jedes CFD-Symbol hinzu, das bei Ihrem Broker verfügbar ist – Indizes, Metalle, Energien usw. Die Matrix ist nicht auf Forex beschränkt
  • Intuitive Farbgebung: grün = positive Korrelation, rot = negative, blau/türkis = schwach

📊 Umsetzbares Info-Panel

  • Live-Kontomesswerte, berechnet aus Ihrem offenen Buch: Kontostand, Eigenkapital, freie Margin, offene PnL, ausstehende Orders und Bruttohebel
  • Währungs-Expositionsaufteilung – sehen Sie Ihre tatsächliche USD-, GBP-, CHF-, AUD-…-Exposition, aggregiert über alle offenen Positionen
  • Konzentrations- und Hebelüberwachung mit Desk-ähnlichen Handlungshinweisen (z. B. Deleverage- oder Konzentrationswarnungen)
  • Überblick über das Spread-Regime bei überwachten Paaren

🎯 Korrelations-Handelssignale

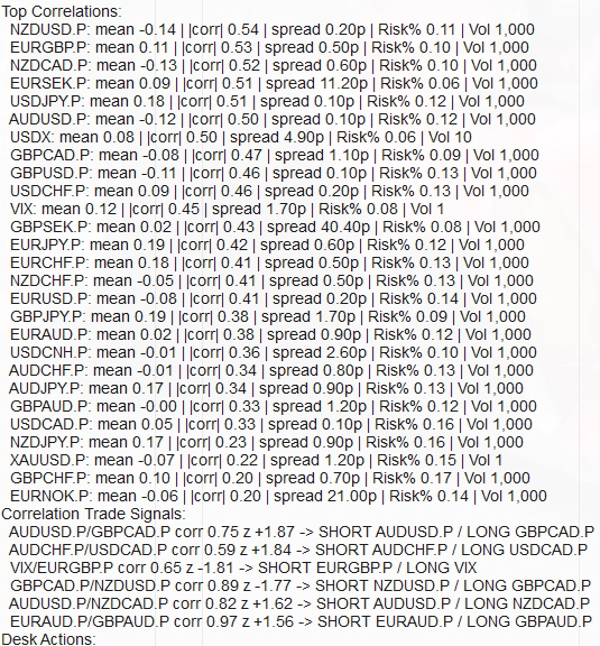
  • Rangiert automatisch die am stärksten korrelierten Paare (mit Mittelwert, |corr|, Spread- und Risikomesswerten)
  • Erzeugt lesbare Long-/Short-Signalkombinationen (z. B. SHORT AUD/USD.P / LONG GBP/CAD.P), um Ihnen zu helfen, abgesicherte, statistisch kohärente Positionen zu strukturieren

⚙️ Vollständig anpassbar

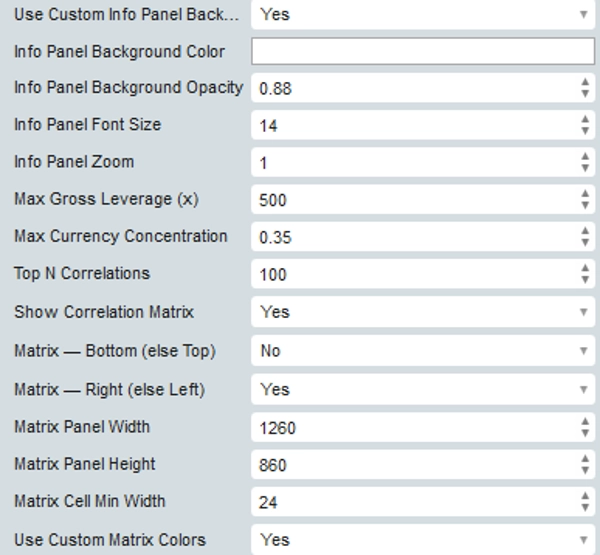
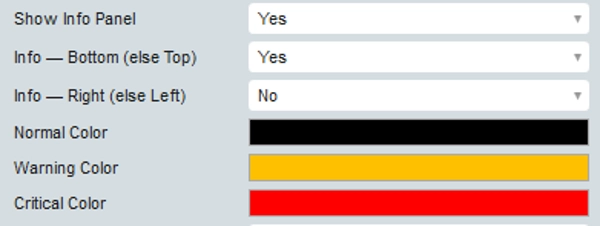
  • Anpassbare Instrumentenliste, Rückblick-Einstellungen, Schwellenwerte und Panel-Layout, um Ihrem Handelsstil zu entsprechen

Für wen ist es geeignet?

  • Forex- & CFD-Trader, die einen systematischen, datengetriebenen Ansatz zur Positionsauswahl wünschen
  • Prop-Firm-Trader, die diszipliniertes, wiederholbares Risikomanagement benötigen, um ihre Konten zu schützen
  • Swing-Trader & Hedger, die versehentliche doppelte Exposition vermeiden möchten

Warum es wichtig ist

Zu wissen, ob sich zwei Instrumente tendenziell gemeinsam oder in entgegengesetzte Richtungen bewegen, ist grundlegend für den Aufbau eines ausgewogenen Buchs. FX‑DESK gibt Ihnen dieses Bewusstsein in Echtzeit, hilft Ihnen zu verstehen warum sich der Markt bewegt, und ermöglicht Ihnen fundiertere, besser abgesicherte Handelsentscheidungen.

Wichtige Informationen

FX‑DESK RISK MANAGEMENT ist ein Analyse- und Entscheidungsunterstützungstool. Es führt keine automatischen Trades aus und garantiert keine Gewinne. Korrelationswerte sind statistische Schätzungen basierend auf historischen Daten und können sich ohne Vorankündigung ändern. Der Handel mit Forex und CFDs birgt ein erhebliches Verlustrisiko und ist möglicherweise nicht für alle Anleger geeignet. Wenden Sie stets ein solides Risikomanagement an


Zusammenfassung

KI-Zusammenfassung
HEDGE FUND FX DESK RISK MANAGEMENT is an indicator designed for Forex and CFD traders seeking systematic, data-driven risk control through cross-asset correlation analysis. It provides a real-time correlation heatmap displaying statistical relationships among FX pairs and other CFD instruments such as indices, metals, and energies, with intuitive color coding to indicate positive, negative, or weak correlations.

The tool includes a live info panel that aggregates account metrics—balance, equity, free margin, open PnL, pending orders, and gross leverage—and offers a currency exposure breakdown across all open positions. It monitors concentration and leverage, providing desk-style action notes to guide risk adjustments, and presents a spread regime overview for monitored pairs.

Additionally, the product generates correlation-based trade signals by ranking top correlated pairs and suggesting long/short combinations to help structure hedged, statistically coherent positions. Users can customize the instrument list, lookback periods, thresholds, and panel layout to fit their trading style.

This analytics and decision-support tool does not execute trades automatically but aids traders in understanding market dynamics and managing overlapping exposures to build balanced, well-hedged portfolios. It is suitable for prop-firm traders, swing traders, and hedgers aiming to avoid accidental double exposure and maintain disciplined risk management.
Indikatorprofil
Indikatorkategorie
Statistik
Ausgabetyp
Visualisierung
Signale
Datenanforderungen
Nur Balken
Unterstützte Signale
Durchbrechen
Abweichung
Wendepunkt
Trendstärke

Kundenbewertungen

5.0
Bewertungen: 1
5
100 %
4
0 %
3
0 %
2
0 %
1
0 %
Kundenbewertungen
August 19, 2026
A comprehensive correlation and portfolio risk dashboard with a large cross-asset heatmap, account metrics, spread monitoring, Top-N correlations, risk-adjusted sizing and actionable pair-trade signals. The full correlation matrix worked well once market data was resolved, although some cells temporarily showed “n/a” after changing chart contexts. The interface is information-dense and best suited to experienced traders or larger screens.

Diskussion

Häufig gestellte Fragen (FAQ)

Drawdown Monitor
Imbalance
Market Structure
Risk Dashboard
Über den cTrader Store verfügbare Produkte, einschließlich Handelsbots, Indikatoren und Plugins, werden von externen Entwicklern bereitgestellt und nur zu Informations- und technischen Zugriffszwecken verfügbar gemacht. cTrader Store ist kein Broker und erbringt keine Anlageberatung, persönlichen Empfehlungen oder eine Garantie für zukünftige Performance.

Mehr von diesem Autor

cBot
VWAP
Signal
+4
Gold Profit Scalper Machine
4
Gewinnfaktor
Indikator
Signal
Order Flow Market Depth Pro | Footprint & DOM
Indikator
Volume
Moving Average
Multi-Timeframe Rolling Volatility Indicator - Smart Volatility Breakout System
cBot
BTCUSD
EPIC FURY
5.56
Gewinnfaktor
Indikator
Forex
BTCUSD
+12
Pro Structure Patterns Detector
cBot
ATR
Volume
+5
HEDGE GRID STRATEGY PRO Advanced Algorithmic Trading System
7%
Rendite
12
Gewinnfaktor
Indikator
VWAP
Volume
+2
VWAP Bands and Swing Wick Structure Indicator
cBot
ATR
Aggressive
+4
F655 T053 V10 3.0L FASTET AND MOST PROFITABLE ALGORITHM IN STORE
1.2
Gewinnfaktor
Indikator
BOS
CHOCH
+5
Market Structure Indicator
Indikator
Prop
BTCUSD
+3
Institutional-grade volatility suite with 4 estimators, VaR/CVaR, spike forecasting & dual-mode buy/sell signals
cBot
ATR
EMA
+2
XAURUM GRID PRO, ADVANCED XAUUSD GRID ALGORITHM
1.15
Gewinnfaktor
Indikator
OBV
Volume
+2
Volume Profile, Order Flow Imbalance & Liquidity Engine Indicator

Das könnte Sie auch noch interessieren

Indikator
Forex
Crypto
+5
ICT Order Block Advanced
Indikator
Grid
Prop
+5
This technical analysis indicator provides information on market sentiment, trend and price levels....
Indikator
VWAP
Volume
+4
Advanced Order Flow & Volume Profiling for cTrader. Unveil institutional footprints, Delta, and Anchored VWAPs.
Indikator
cTreder Smart SMA
Indikator
AI
ATR
+19
Market Cipher A
Indikator
Forex
Fibonacci
+2
Enhance your trading with customizable alerts and dynamic visual tools for trendlines, Fibonacci levels, and more.
Indikator
CHOCH
Fair Value Gap
+2
Advanced FVG & IFVG indicator with multi-timeframe confluence, CHoCH filtering, and smart mitigation.
Indikator
Forex
Crypto
+3
Enhance Pitchfork & Price Channels in cTrader with customizable Equidistant and Fibonacci levels.
Indikator
Key Levels
Support & Resistance
Professional Opening Range Breakout indicator with live ORB levels and breakout detection.
Indikator
SMC
Breakout
+1
Delta Peak Bubbles is a tick‑chart overlay for cTrader that highlights the strongest momentum spikes.
Indikator
RSI
SMC
+17
Turn WaveTrend Cross into a BTC profit machine precise buy sell signals, smart momentum edge, no lag trading system
Indikator
Track VWAP for Asia, London, NY, Sydney, Daily, Weekly, Monthly & Custom Sessions. Perfect for FX & intraday trading!
Indikator
Supertrend
Premium visual market-regime indicator for cTrader. Works beautifully with BTC on the 1D timeframe.
Indikator
Forex
NAS100
+3
volumen perfile
Indikator
SMC
Forex
+15
Session-based range tool projecting adaptive Gann & Fib levels with auto bias flip and extensions.
Indikator
ATR
Forex
+9
Auto-detect swing highs/lows. Spot reversals, map structure, and filter noise with adjustable strength.
Indikator
Prop
Forex
+2
Vision - Advanced Session Indicator
Indikator
ATR
RSI
+6
🔍 MultiScalpScorePRO – Powerful real-time scoring system combining indicators for ultra-precise scalping signals.

Preis

51
Verkäufe
306
Kostenlose Installationen