
Beschreibung
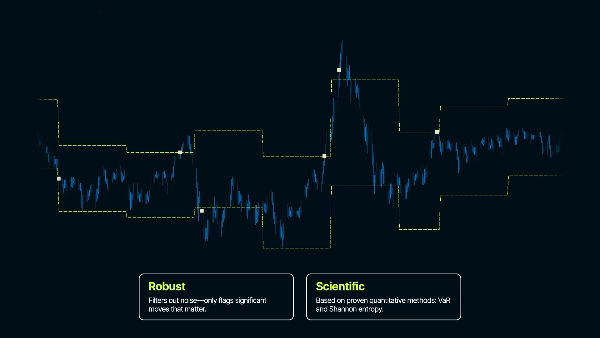
Price Jump Exit and Re-entry (PjER ) Indicator ist ein Risikomanagement-Indikator, der auf dem wissenschaftlichen Artikel „A dynamic price jump exit and reentry strategy for intraday trading“ von Koegelenberg & van Vuuren (2024), veröffentlicht im Expert Systems With Applications Journal.
Wichtige Innovation
- VaR-Schätzungen potenzieller Verluste, bevor sie eintreten
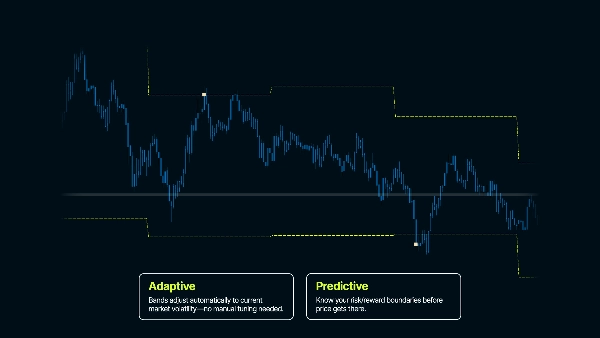
- Robustheit gegenüber starken Markttrends über kurze Zeiträume
- Analyse der Marktkorrektur nach Sprüngen für sicheren Wiedereinstiegszeitpunkt
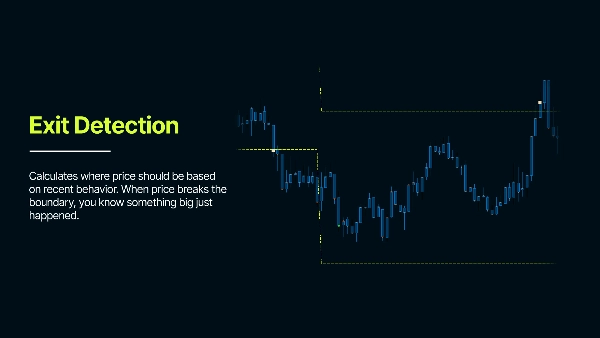
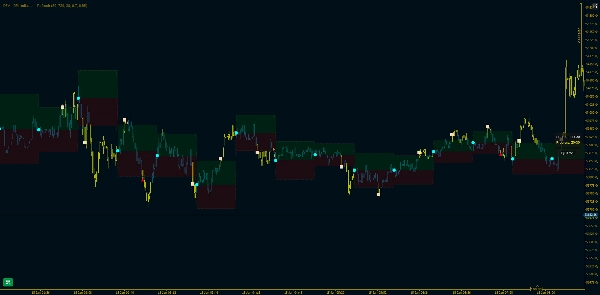
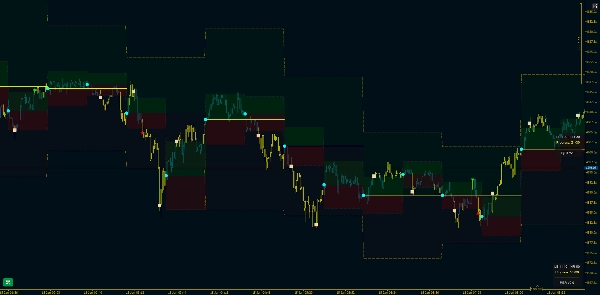
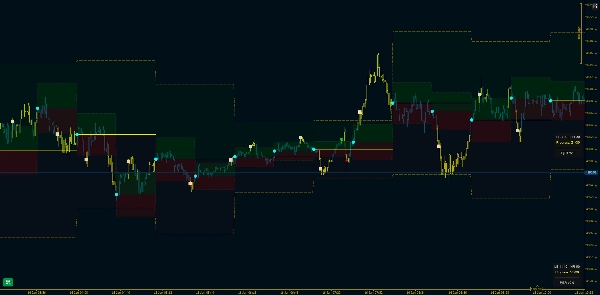
Es analysiert vergangene Kursbewegungen, um die typische Volatilität zu verstehen, und erstellt Konfidenzintervalle - die den erwarteten Kursbereich darstellen. Wenn der Kurs außerhalb dieser Bänder springt, signalisiert dies, dass etwas Ungewöhnliches passiert ist.
Zielanwendungsfall
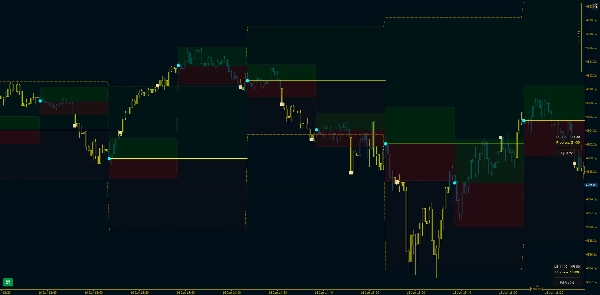
Intraday-Handel (insbesondere strategie-basierte Strategien). Dieser Indikator erstellt statistische Grenzen um den Kurs, um ungewöhnliche Kursbewegungen zu erkennen. Im normalen Marktverhalten bleibt der Kurs innerhalb der erwarteten Bereiche basierend auf der jüngsten Volatilität. Wenn der Kurs diese Bänder durchbricht, signalisiert dies, dass etwas Ungewöhnliches passiert – ein potenzieller Ausstiegspunkt aus einem Trade oder ein Ausbruch in der Marktstruktur, da sich das Marktverhalten geändert hat.
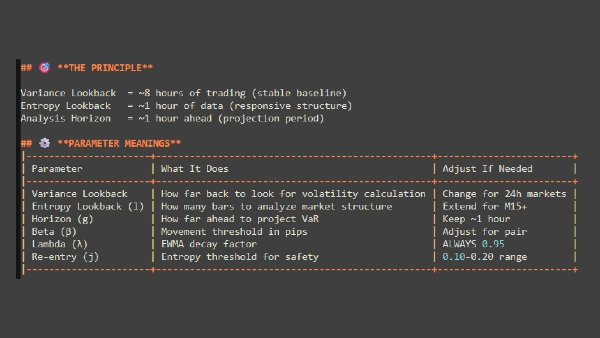
Erklärung der Kernparameter
Max Days Back - Bestimmt, wie weit in der Vergangenheit der Indikator zu arbeiten beginnt
GMT Offset - Passt die Zeitzone an. Stellt sicher, dass Datumsberechnungen mit Ihrer Ortszeit übereinstimmen
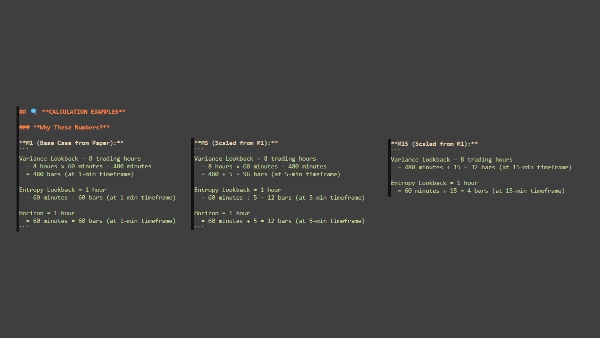
Lookback Period (bars)
„Wie viel Kursverlauf soll ich verwenden, um das 'normale' Verhalten zu messen?“
- Wie viele Balken historischer Daten zur Berechnung der Volatilität verwendet werden
- Mehr Balken = stabiler, aber langsamer in der Anpassung; weniger Balken = schnellere Reaktion, aber rauschiger
- Beispiel: 1440 Balken auf M1 = 24 Stunden Daten
Analysehorizont (bars)
„Wie lange soll ich den Kurs beobachten, bevor ich neu starte?“
- Wie lange jede Analyseperiode dauert, bevor die Bänder zurückgesetzt werden
- Legt den Zeitraum fest, den Sie analysieren – kürzer = häufigere Rücksetzungen, länger = Bänder bleiben länger fixiert
- Beispiel: 60 Balken = Bänder bleiben 60 Balken lang, dann Neuberechnung vom neuen Referenzpreis
Risiko-Wahrscheinlichkeit
„Wie sicher möchte ich sein, dass der Kurs diese Niveaus normalerweise nicht erreicht?“
- Legt das Konfidenzniveau für die Bänder fest (wie eine Sicherheitsmarge)
- Höhere Werte = breitere Bänder (weniger Signale), niedrigere Werte = engere Bänder (mehr Signale)
- Beispiel: 0.80 = 80 % Sicherheit, dass der Kurs unter normalen Bedingungen innerhalb der Bänder bleibt
Abklingfaktor (λ - Lambda)
„Soll ich mehr Wert auf das legen, was gerade passiert ist, oder die gesamte Historie gleich behandeln?“
- Steuert, wie viel Gewicht den jüngsten Daten gegenüber älteren Daten bei der Volatilitätsberechnung gegeben wird
- Höhere Werte = jüngste Daten sind wichtiger; niedrigere Werte = alle Daten werden gleichmäßiger gewichtet
- Beispiel 0.95 = die jüngste Volatilität beeinflusst die Berechnung stark
WICHTIGE PUNKTE ZUM MERKEN
Dies ist ein RISIKOMANAGEMENT-Tool – Identifiziert Volatilitätsereignisse und Stabilität über Zeiträume
Konfidenzintervalle sind entscheidend – Bänder dürfen dem Kurs nicht wie ATR folgen – Bänder werden für jede Analyseperiode berechnet
Wiedereinstieg erfordert Geduld – Erwarten Sie keinen sofortigen Wiedereinstieg nach dem Ausstieg – Der Markt braucht Zeit, um sich zu stabilisieren
Parameter sind asset- und zeitraum-spezifisch – Standardparameter sind Ausgangspunkte – Optimieren Sie für Ihren spezifischen Markt und Stil – Was im FX funktioniert, funktioniert möglicherweise nicht für Indizes, Metalle oder Krypto.
( * ) Dieser Indikator wird nur zu Bildungs- und Informationszwecken bereitgestellt. Er ist nicht als Finanz- oder Anlageberatung gedacht. Nichts in diesem Produkt, seiner Dokumentation oder verwandten Materialien sollte als Empfehlung zum Kauf, Verkauf oder Halten eines Finanzinstruments ausgelegt werden. Der Handel an Finanzmärkten birgt erhebliche Risiken und ist möglicherweise nicht für alle Anleger geeignet. Vergangene Leistungen sind kein Indikator für zukünftige Ergebnisse. Es gibt keine Gewinn-Garantie, und Nutzer können erhebliche Verluste erleiden. Durch die Nutzung dieses Indikators erkennen Sie an, dass Sie allein für Ihre eigenen Handelsentscheidungen und finanziellen Ergebnisse verantwortlich sind. Der Ersteller dieses Produkts haftet nicht für Verluste oder Schäden, die direkt oder indirekt aus der Nutzung entstehen. Führen Sie stets Ihre eigene Analyse durch, bevor Sie Handelsentscheidungen treffen.
Zusammenfassung
Key features include Value at Risk (VaR) estimates to anticipate potential losses, robustness against strong short-term trends, and analysis of post-jump corrections to identify safe re-entry timings. Core adjustable parameters allow users to tailor the indicator to specific assets and timeframes, including lookback period for volatility calculation, analysis horizon for band recalculation frequency, risk probability to set confidence levels, and decay factor to weight recent versus older data.
The indicator emphasizes patience for re-entry after exits, as market stabilization is required. It is intended as a tool for identifying volatility events and managing risk rather than providing direct trade signals. Users should optimize parameters according to their trading style and market conditions.
Kundenbewertungen
5 | 100 % | |
4 | 0 % | |
3 | 0 % | |
2 | 0 % | |
1 | 0 % |


