
الوصف
موصل IR المفتوح
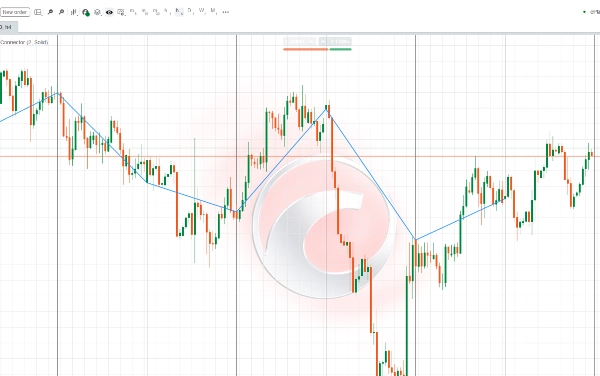
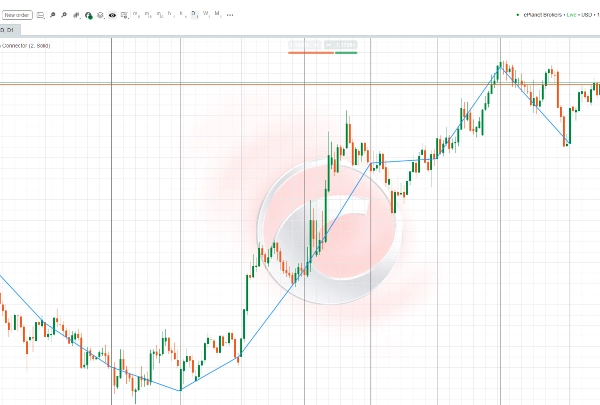
تم تصميم هذا المؤشر لربط أسعار الافتتاح لشموع الأطر الزمنية الأعلى، اعتمادًا على إطار الرسم البياني الحالي:
- إذا كان الإطار الزمني أقل من ساعة → يربط افتتاح شموع اليومية.
- إذا كان الإطار الزمني 4 ساعات → يربط افتتاح شموع الأسبوعية.
- إذا كان الإطار الزمني أعلى من 4 ساعات ولكن أقل من الأسبوعية → يربط افتتاح شموع الشهرية.
هذا يسمح للمتداولين برؤية واضحة لمستويات الافتتاح الرئيسية للفترات الأعلى (يومية، أسبوعية، شهرية) مباشرة على مخططاتهم. غالبًا ما تُعتبر هذه المستويات مناطق حرجة للدعم والمقاومة، ومناطق محتملة لبدء الاتجاهات، ونقاط مرجعية مهمة في تحليل السوق.
لون الخط وسمكه ونمطه قابلة للتخصيص بالكامل، مما يمنحك المرونة لتكييف العرض مع أسلوب تداولك الشخصي.
این اندیکاتور طراحی شده تا نقاط باز شدن کندلهای تایمفریمهای بالاتر را بسته به تایمفریم فعلی شما به هم متصل کند:
- اگر تایمفریم کمتر از یک ساعت باشد → باز شدن کندلهای روزانه را به هم وصل میکند.
- اگر تایمفریم چهارساعته باشد → باز شدن کندلهای هفتگی را به هم وصل میکند.
- اگر تایمفریم بزرگتر از چهارساعته و کوچکتر از هفتگی باشد → باز شدن کندلهای ماهانه را به هم وصل میکند.
این ویژگی به معاملهگر کمک میکند تا به سادگی سطوح مهم شروع دورههای بزرگتر (روزانه، هفتگی، ماهانه) را روی نمودار مشاهده کند. این سطوح اغلب بهعنوان نقاط کلیدی حمایت و مقاومت، شروع روندهای جدید یا محدودههای معاملاتی مهم در نظر گرفته میشوند.
با تنظیم رنگ، ضخامت و نوع خط، میتوانید نمایش این خطوط را مطابق با سبک معاملاتی خود شخصیسازی کنید.


