
Deskripsi
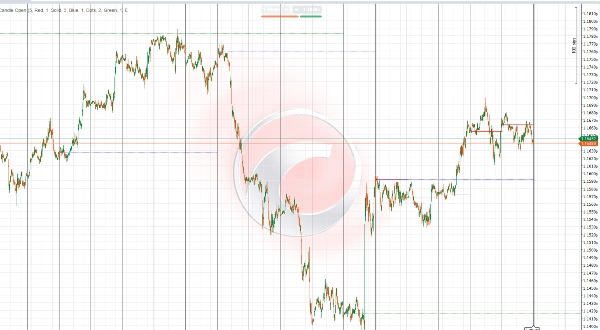
Indikator Pembukaan Lilin IR adalah alat serbaguna dan dapat disesuaikan yang memplot harga pembukaan lilin mingguan, harian, dan bulanan pada grafik perdagangan Anda. Pedagang dapat memilih jumlah periode (hari, minggu, bulan) yang akan ditampilkan, memungkinkan analisis multi-timeframe yang fleksibel sesuai dengan strategi mereka.
Fitur utama meliputi:
- Pemetaan tepat pembukaan lilin untuk jumlah periode harian, mingguan, dan bulanan yang ditentukan pengguna.
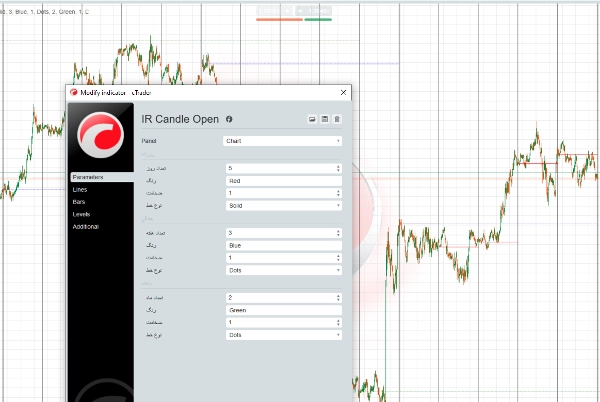
- Gaya garis yang dapat disesuaikan: pengguna dapat memilih jenis garis (padat, putus-putus, titik), warna, dan ketebalan untuk meningkatkan keterbacaan grafik.
- Mendukung visualisasi multi-timeframe untuk membantu mengidentifikasi level harga penting di berbagai horizon waktu.
- Membantu dalam mengenali zona support dan resistance potensial berdasarkan harga pembukaan penting ini.
- Kompatibel dengan berbagai pasar seperti Forex, komoditas, indeks, dan cryptocurrency.
Fleksibilitas ini memberdayakan pedagang untuk menyesuaikan tampilan indikator sesuai preferensi pribadi dan gaya perdagangan mereka, meningkatkan kejelasan dan memperbaiki pengambilan keputusan berdasarkan level harga penting.
توضیح فارسی (بهروز شده)
اندیکاتور IR Candle Open ابزاری منعطف و قابل تنظیم است که قیمتهای باز شدن کندلهای هفتگی، روزانه و ماهیانه را روی نمودار معاملاتی شما نمایش میدهد. کاربران میتوانند تعداد دورههای روزانه، هفتگی و ماهیانه که میخواهند خطوط آنها نمایش داده شود را انتخاب کنند تا تحلیل چندتایمفریمی متناسب با سبک معاملاتی خود داشته باشند.
ویژگیهای کلیدی:
- نمایش دقیق خطوط قیمت باز شدن کندلها برای تعداد دورههای دلخواه در تایمفریمهای روزانه، هفتگی و ماهیانه.
- امکان انتخاب نوع خط (ساده، خطچین، نقطهچین)، رنگ و ضخامت خطوط برای بهبود وضوح و خوانایی نمودار.
- پشتیبانی از تحلیل چندتایمفریمی جهت شناسایی سطوح مهم قیمتی در بازههای زمانی مختلف.
- کمک به تشخیص سطوح حمایت و مقاومت احتمالی بر اساس این نقاط کلیدی باز شدن قیمتها.
- مناسب برای استفاده در بازارهای مختلف مانند فارکس، کالاها، شاخصها و رمزارزها.
این قابلیتها به تریدرها امکان میدهد تا نمایش اندیکاتور را بر اساس سلیقه و سبک معاملاتی خود تنظیم کنند و با وضوح بیشتر، تصمیمات بهتری بگیرند.
Ringkasan
Ulasan pelanggan
5 | 100 % | |
4 | 0 % | |
3 | 0 % | |
2 | 0 % | |
1 | 0 % |


![Logo "[Stellar Strategies] Smart ADX"](https://cdn.ctrader.com/image/webp/af13b084-b6f6-41db-b7bc-c7e688b57b05_36929)


