
说明
🏆 超过10,000名交易者信赖我们的25+算法套件! 🏆
从 市场结构与流动性 到 智能退出系统与预测工具 - 我们构建了您实现持续盈利所需的每一个工具。
👉 访问全部25+经过验证的系统:
_______________________________________________
📌 市场结构指标
· ✅ 高级市场结构:Bos,Choch,SwinLevels,订单区块, 市场结构与流动性探测器
· 🔄动态市场结构转折点分析
· 🧱 订单区块
· ⚖️ 市场失衡
· ⛓️ BOS 与 CHOCH
· 🧠 ICT 三力法则
· 🌀 市场极性区域
_______________________________________________
🔚 智能退出系统
· 📍 跟踪智能算法
_______________________________________________
📐 之字形指标
· 🔍 之字形价格流动性投影
· 🧭 支撑阻力结构之字形
· ➖ 之字形
· 🎯 之字形极端追踪器
_______________________________________________
🧱 支撑与阻力指标
· 🟩 智能趋势支撑与阻力线
· 🧱 所有支撑和阻力水平
_______________________________________________
📊 趋势与通道指标
· 🔄 自动趋势通道
· 📊 超级趋势
· ⚡动量趋势分析器
· 🧠 自适应趋势通道
· 💥 通道突破系统
· 🌈 动态趋势梯度
· ⭐ 高级SSL通道
· 🔁 反应式移动平均线
_______________________________________________
💧 成交量与流动性工具
· 🔥 成交量POC热力图
· 📉 杠杆清算图
· 🔍 动量公允价值缺口
· 🕒 公允价值缺口时段
_______________________________________________
⚡ 动量与RSI指标
· 📈 RSI趋势触发器
· 🚀 动态区间动量
· 🔎 多级蜡烛偏向
追踪器
_______________________________________________
🔮 预测与投影工具
· 📐 基于线性回归与ATR的预测
· 📏 斐波那契线性回归多时间框架
· 📈 成交量驱动市场流动投影器_________________________
_________________________________________________________________________________________________
_________________________________________________________________________________________________
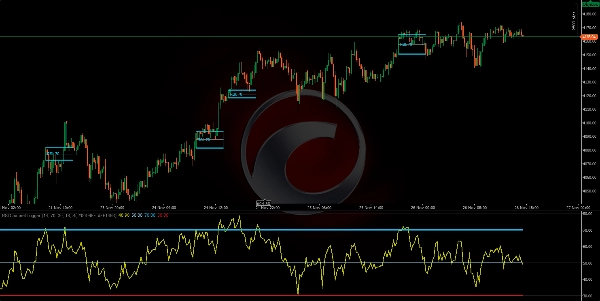
RSI通道触发器: 📶
它是什么: 一个计算RSI(周期)并在RSI穿越超买/超卖阈值(默认70/30)时,直观标记动量区域的指标。✅
https://chartshots.spotware.com/c/69278f8b6d973
逻辑: 当阈值被穿越时,它基于穿越时蜡烛的高低点创建一个“区域”。然后:🧠
- 为该区域内的蜡烛着色。
- 绘制一个通道(高点、低点、中线)。
- 在RSI面板上用圆圈和标签标记穿越点。
该区域持续时间正好为 MinZoneDuration 根K线。⏱️
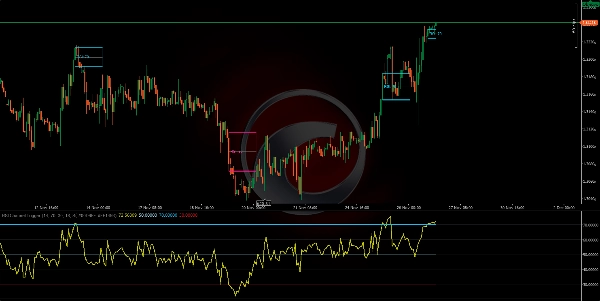
明确信号:
- 穿越 超买区以上 → 触发一个 看涨区域。🟢
- 穿越 超卖区以下 → 触发一个 看跌区域。🔴
该区域本身是一个 关注区域,而非订单。
https://chartshots.spotware.com/c/69278fb274e0b
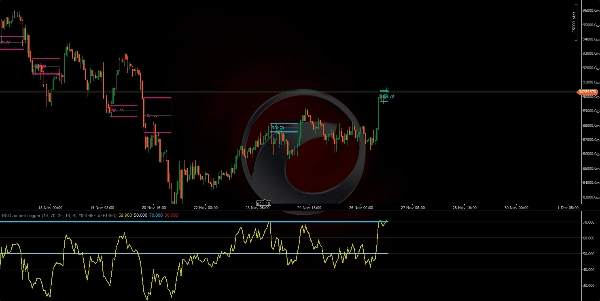
快速使用方法:
- 等待区域形成。🎯
- 通过 价格行为 确认(突破/拒绝通道线)。
- 在区域外设置 止损,并以通道中线或定义的风险/回报比作为 目标。
https://chartshots.spotware.com/c/69278fe76237b
关键参数: ⚙️
- RSI周期(14)
- 超买(70)
- 超卖(30)
- 最小区域持续时间(15)
- 可配置颜色 🎨
摘要
Clear signals include:
- RSI crossing above the overbought level, initiating a bullish momentum zone.
- RSI crossing below the oversold level, initiating a bearish momentum zone.
These zones serve as areas of interest rather than direct trade orders. Users can confirm signals with price action such as breakouts or rejections from channel lines and plan entries with stop losses placed outside the zone and targets at the mid-channel line or based on risk/reward ratios.
The indicator supports multiple markets and symbols including Forex pairs (EURUSD, GBPUSD, NZDUSD, USDJPY), commodities (XAUUSD), indices (NAS100), cryptocurrencies (BTCUSD), and stocks. It offers configurable parameters for RSI period, threshold levels, zone duration, and colors.


