present
Daftar dan dapatkan diskon $50 untuk pembelian pertama Anda
Trading product for IR Spread Indikator, image 1
IR Spread
5.0
Ulasan: 2
5.63K
Instal gratis

Deskripsi

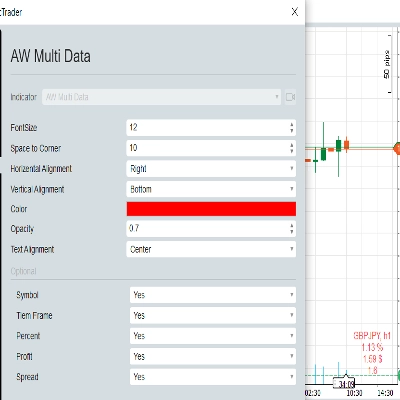
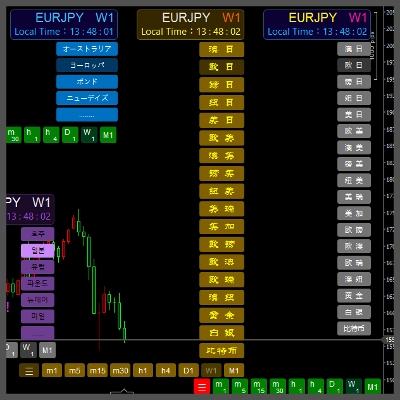
tampilkan spread saat pembaruan grafik

Telegram Channel dukung kami untuk lebih banyak indikator dan bot gratis

Ringkasan

Ringkasan AI
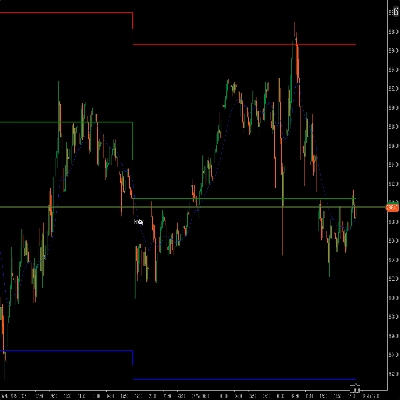
IR Spread is a trading indicator designed to display the spread directly on the chart during updates. It provides real-time visualization of the spread, helping traders monitor this key metric within their trading platform interface. The indicator integrates seamlessly with chart updates, ensuring that spread information is current and easily accessible.
Profil indikator

Diskusi

Ulasan pelanggan

5.0
Ulasan: 2
5
100 %
4
0 %
3
0 %
2
0 %
1
0 %
Ulasan pelanggan
June 4, 2026
didn't check deep enough so far but it seems perfect and smooth
November 18, 2025

Pertanyaan umum

Produk-produk yang tersedia melalui cTrader Store, termasuk bot trading, indikator, dan plugin, disediakan oleh pengembang pihak ketiga serta hanya ditujukan untuk akses teknis dan informasi. cTrader Store bukan broker dan tidak menyediakan saran investasi, rekomendasi pribadi, atau jaminan apa pun tentang kinerja di masa mendatang.

Produk lain dari penulis ini

Logo "IR Candle MTF"
4.6
(6)
Gratis
with this indicator you could see other time frame candle in your chart.
some user add moving average to macd to see better. in ctrader 4.3.11 there is a problem with this . I make a macd tha
this indicator show macd on chart.
Multi Time Frame Moving Average is a powerful and flexible indicator for cTrader
 this moving include everything that a trader needs from Moving Average.
this indicaotr show distance between Tenkan to Kijun, Close to Kijun and Close to Tenkan 
Add Slowing to IR Moving Average.
IR Candle Open plots customizable opening price lines for daily, weekly, and monthly candles
Coral indicator
you could put your check list in your chart you could split your test with “,” you could put your checklist in indicat
this indicator show other time frame close in lower time frame. for ex: show daily close in m 15.
don't move to the end of chart after timeframe changing. it should be better to use for near history. for long history

Anda mungkin juga suka

this indicator shows previous day high low and closed with precise manner.
Strong Supertrend Turn Market Movement into a Clear Map Market analysis
RSI on the main chart with 45/55 momentum levels, overbought/oversold levels, averaged RSI, and multi-timeframe support.
Custom and native timeframes display with OHLC lines, moving averages, and Fibonacci levels.
Compare up to 27 symbols across eight timeframes with seven analysis engines and an interactive cTrader dashboard.
Advanced Market Sessions with ICT killzones
Opening ranges, dynamic trend channels, and multi-scale breakout/retest analysis for clear intraday chart decisions.
Volumen Delta", es una representación visual del flujo de órdenes basada en el volumen de transacciones.
Half Trend – Trend Reversal Indicator for cTrader
INDICATOR,LIQUIDITY POOLS,ACCURATE SIGNAL, NO DELAY,80% PROBABILITY
Signal Quality Score - 0-100 filter combining RSI, Volume, ATR, Trend Strength & Alignment. Works on ANY chart type.
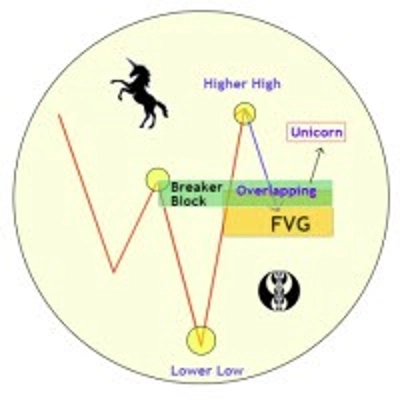
Unicorn Model ICT Indicator — Smart Trading with Precision
A professional-grade cTrader indicator for traders following the Inner Circle Trader (ICT) methodology. It replaces 6–8
Smart Support/Resistance lines auto calculated from D1/H4/H1/M15. Highly customizable visuals + built in Backtest Mode.
VWAP Bands and Swing Wick Structure Indicator
📈 Anchored VWAP with auto High/Low, session resets, Daily VWAP & TWAP — precise, Pine-accurate port.
This indicator can be used to: change color, shape size, position, change font, increase or decrease, and other function
MultiTimeframe MA

Harga

5.63K
Instal gratis