
Mô tả
Chỉ báo BLOCK LIQUIDITY kết hợp hai phương pháp chính để phân tích thị trường:
Phát hiện Order Block:
Xác định các vùng hỗ trợ và kháng cự dựa trên các đỉnh và đáy chưa bị phá vỡ trong một khoảng thời gian nhìn lại.
Tạo tín hiệu mua khi giá đóng cửa trên một đáy chưa bị phá vỡ.
Tạo tín hiệu bán khi giá đóng cửa dưới một đỉnh chưa bị phá vỡ.
Phân tích Thanh khoản:
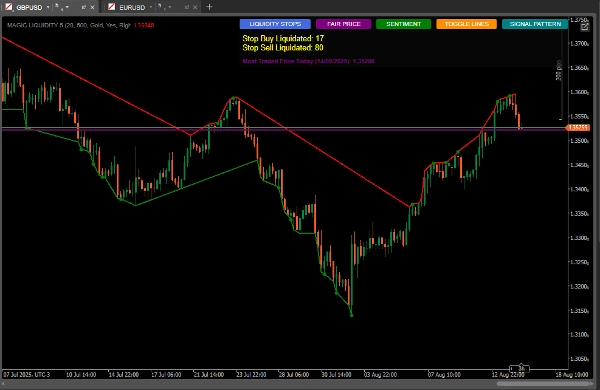
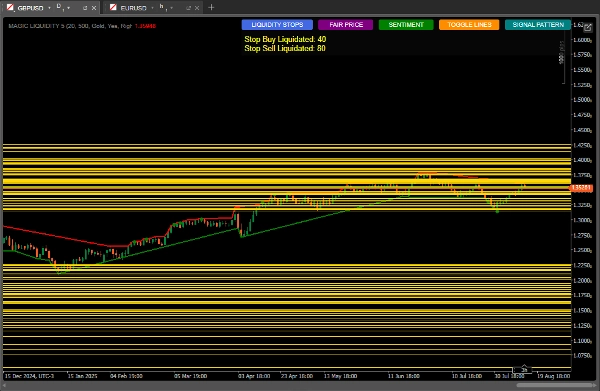
Phát hiện các vùng thanh khoản (khu vực có thể tập trung các điểm dừng lỗ).
Theo dõi việc kích hoạt các điểm dừng mua và bán.
Tính toán tâm lý thị trường dựa trên phân phối thanh khoản.
Xác định giá được giao dịch nhiều nhất (giá công bằng).
Cách sử dụng để đạt kết quả tốt nhất
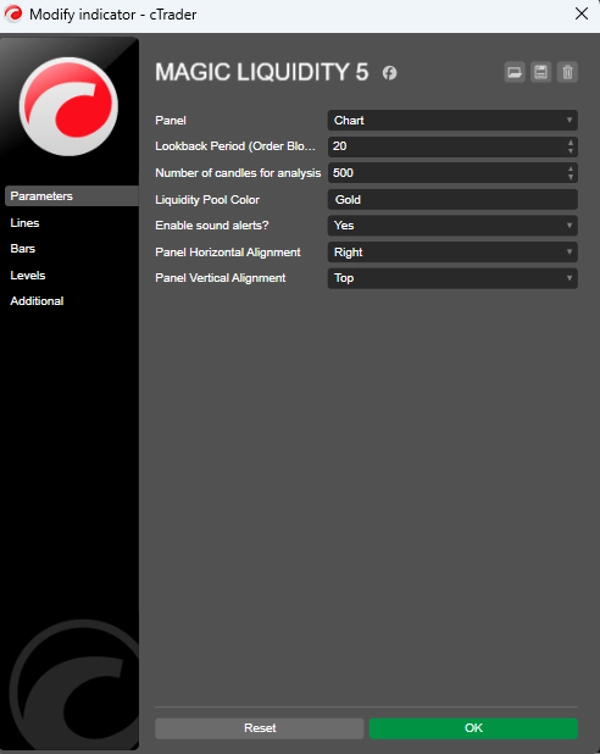
Cấu hình ban đầu
Khoảng thời gian nhìn lại: Điều chỉnh tham số "Lookback Period" theo khung thời gian bạn đang giao dịch (giá trị cao hơn cho các khung thời gian lớn hơn).
Số lượng nến để phân tích: Giữ ở mức 500 để phân tích chắc chắn hoặc giảm để phản ứng nhanh hơn.
Màu sắc vùng thanh khoản: Chọn màu nổi bật trên biểu đồ của bạn.
Diễn giải tín hiệu
Tín hiệu Order Block:
Chấm xanh: Tín hiệu mua khi giá đóng cửa trên một đáy chưa bị phá vỡ.
Chấm đỏ: Tín hiệu bán khi giá đóng cửa dưới một đỉnh chưa bị phá vỡ.
Vùng thanh khoản:
Các đường ngang hiển thị các vùng thanh khoản (mục tiêu tiềm năng hoặc điểm đảo chiều).
Theo dõi mối quan hệ giữa thanh khoản phía trên/dưới giá hiện tại.
Tâm lý thị trường:
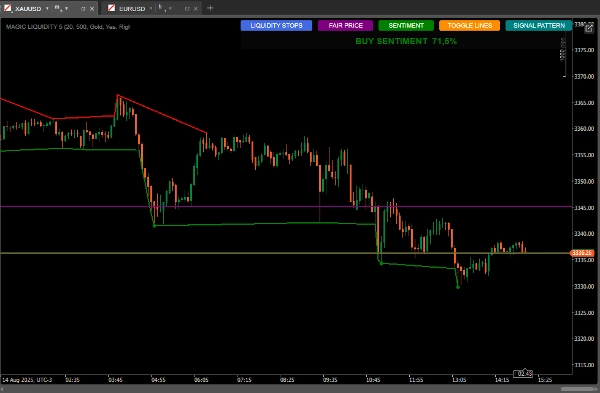
Sử dụng nút "SENTIMENT" để xem hướng đi và độ tin cậy hiện tại.
Tâm lý mua với độ tin cậy cao cho thấy sự tăng trưởng tiếp tục. Tâm lý bán với độ tin cậy cao cho thấy xu hướng giảm tiếp diễn.
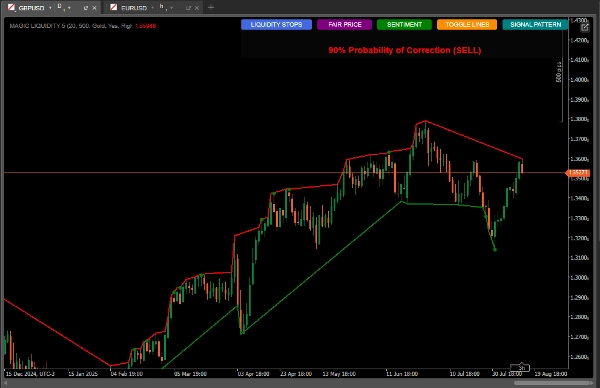
Mẫu nến:
Nút "SIGNAL PATTERN" phân tích và
Hiển thị xác suất điều chỉnh dựa trên tỷ lệ định lượng
Giá được giao dịch nhiều nhất (Giá công bằng):
Nút "FAIR PRICE" hiển thị mức giá có khối lượng giao dịch cao nhất trong ngày.
Nó có thể hoạt động như một nam châm hút giá hoặc như hỗ trợ/kháng cự.
Chiến lược sử dụng
Chiến lược bảo thủ:
Chỉ giao dịch khi tín hiệu order block trùng với tâm lý thị trường hiện tại.
Sử dụng vùng thanh khoản làm mục tiêu chốt lời.
Chiến lược tích cực:
Dự đoán đảo chiều khi giá tiếp cận các vùng thanh khoản có nhiều điểm dừng tích lũy.
Sử dụng sự phân kỳ giữa tâm lý và hành động giá cho các giao dịch ngược xu hướng.
Xác nhận bổ sung:
So sánh với mẫu nến được chỉ báo hiển thị.
Kiểm tra xem giá công bằng có gần đó như một vùng quan tâm không.
Quản lý rủi ro.
Dừng lỗ:
Đặt dưới order block gần nhất cho lệnh mua
Đặt trên order block gần nhất cho lệnh bán
Chốt lời:
Mục tiêu tại các vùng thanh khoản gần đó
Xem xét tỷ lệ thanh khoản trên/dưới để đặt mục tiêu
Mẹo nâng cao
Sử dụng nút "TOGGLE LINES" để tắt các đường thanh khoản khi biểu đồ trở nên lộn xộn
Theo dõi số lượng điểm dừng bị thanh lý để đánh giá sức mạnh của đợt di chuyển
Giá công bằng đặc biệt hữu ích trong các thị trường đi ngang như hỗ trợ/kháng cự động
Kết hợp với các chỉ báo khác để xác nhận (khối lượng, trung bình động)
Khối lượng chỉ báo:
https://ctrader.com/pt/products/635
Tóm tắt
Users can customize parameters such as lookback period and number of candles analyzed to suit different timeframes and trading styles. Visual signals include green and red dots for buy and sell order block signals, and horizontal lines marking liquidity pools. Additional features include sentiment indication with confidence levels, candlestick pattern analysis for correction probabilities, and toggling of liquidity lines for chart clarity.
Recommended strategies include trading in the direction of order block signals aligned with sentiment for conservative approaches, or anticipating reversals near liquidity pools for aggressive trades. Risk management is supported by placing stop-loss orders relative to recent order blocks and setting take-profit targets at liquidity pools. The indicator can be combined with other tools like volume and moving averages for confirmation.
Đánh giá của khách hàng
5 | 100 % | |
4 | 0 % | |
3 | 0 % | |
2 | 0 % | |
1 | 0 % |


