
Description
La meilleure façon de penser à l'Indice Composite tel qu'il s'applique au RSI est de considérer le RSI comme Windows 3.0 et l'Indice Composite comme Windows 10. Constance Brown a découvert que le RSI, bien qu'il crée et détecte des divergences, n'est pas aussi précis qu'il pourrait l'être. C'est un peu un oxymore de dire cela, mais le RSI est un indicateur de momentum sans aucun calcul de momentum qui lui soit attaché. Le RSI manque une quantité significative de mouvements importants et génère même certains mauvais mouvements. Ce que Constance Brown a fait avec le RSI, c'est d'intégrer un calcul de momentum directement dans le RSI lui-même. Cet indice supprime les restrictions de plage de normalisation dans le RSI. Cela signifie qu'il n'est pas limité à la plage 0-100.
Le RSI et l'Indice Composite Ensemble
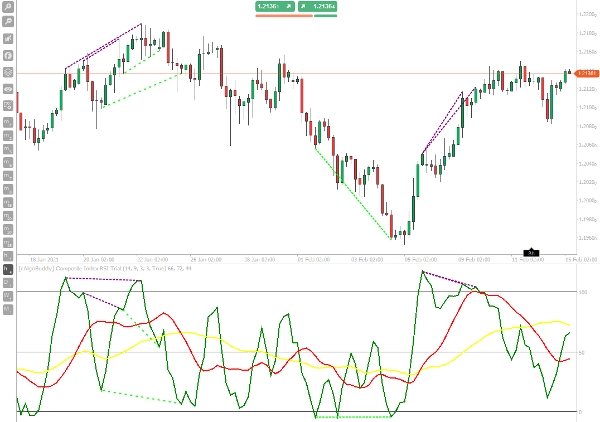
Une des stratégies que Constance Brown a employées avec l'Indice Composite était de comparer l'Indice Composite au RSI. Lorsque nous cherchons des divergences, nous recherchons des choses comme la divergence haussière. Une divergence haussière se produit lorsque le prix crée des sommets plus hauts, mais que l'oscillateur montre des sommets plus bas. Lorsque nous utilisons le RSI et l'Indice Composite ensemble, nous traitons le RSI comme nous le ferions avec un graphique de prix et l'Indice Composite est l'oscillateur.
L'indicateur possède une ligne RSI normale interne pour repérer les divergences, donc le travail a été fait pour vous. Tradez les signaux de divergence comme vous le feriez avec tout autre oscillateur.
La principale caractéristique de l'Indice Composite est de représenter le momentum avec des signaux d'opération clairs. Ainsi, lorsque le RSI entre dans une zone de surachat ou de survente, le croisement de l'Indice Composite avec ses moyennes mobiles dans la direction opposée représente un bon signal de trading, puis, en encadrant cette symbiose du momentum de l'oscillateur avec l'action du prix sur les supports et résistances, vous obtenez une logique de trading très intéressante et gagnante, qui convient également bien au trading des cryptomonnaies.
Comment Utiliser
La stratégie de l'Indice Composite est une stratégie d'action de prix basée sur le momentum, fondée sur une combinaison de niveaux de support et de résistance avec les niveaux de surachat et de survente de l'Indice de Force Relative et de l'Indice Composite. L'Indice Composite dans cette stratégie de trading est également le moment final d'entrée.
Période : H1+, Toujours utiliser cela avec le RSI.
Acheter
- Le prix rebondit sur le support.
- Les moyennes mobiles RSI composites sont en dessous du niveau 50 et la MA rapide (Rouge) est inférieure à la MA lente (jaune).
- Le RSI crée un creux et la valeur est proche ou inférieure à 30 et l'Indice Composite a également un creux.
- Nous achetons dès que l'Indice Composite croise à la hausse les moyennes mobiles.
Vendre
- Le prix rebondit sur la résistance.
- Les moyennes mobiles composites sont au-dessus du niveau 50 et la MA rapide (Rouge) est supérieure à la MA lente (jaune)
- Le RSI a un pic et la valeur est proche ou supérieure à 70 et l'Indice Composite a également un pic.
- Nous vendons à découvert lorsque l'Indice Composite croise à la baisse les moyennes mobiles (c'est le moment d'entrer sur le marché).
Résumé
Avis clients
5 | 0 % | |
4 | 100 % | |
3 | 0 % | |
2 | 0 % | |
1 | 0 % |


