
Description
Price Magnet : Densité de Prix Avancée & Niveaux Institutionnels
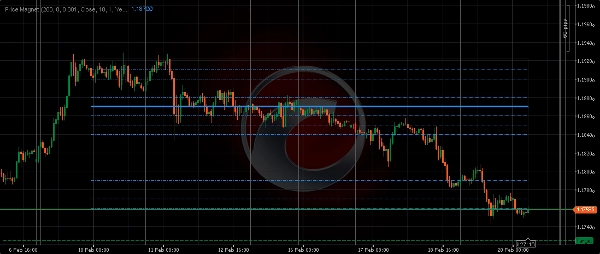
Price Magnet est un outil d'analyse professionnel pour cTrader conçu pour révéler où la "Smart Money" accumule des positions. Contrairement aux oscillateurs standard ou aux indicateurs de tendance, Price Magnet utilise une approche mathématique pour identifier les zones d'intérêt maximal du marché en calculant la Densité de Prix.
Comment ça fonctionne
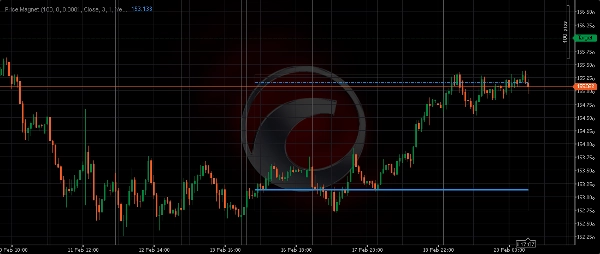
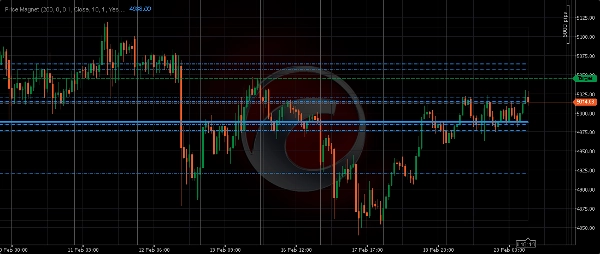
Le marché revient souvent aux niveaux où il a passé le plus de temps. Ce sont les "Magnets". Cet indicateur analyse une profondeur historique spécifique, regroupe l'action des prix en groupes de fréquence, et met en évidence les niveaux les plus forts qui sont susceptibles d'agir comme des aimants futurs pour le prix.
Guide détaillé des paramètres
Pour tirer le meilleur parti de Price Magnet, il est essentiel de comprendre sa configuration :
- Profondeur d'analyse (Barres) : Détermine combien de chandeliers historiques l'indicateur analyse.
-
- Court terme (50-100) : Idéal pour le scalping et le day trading.
- Long terme (300-500) : Idéal pour identifier les grandes zones institutionnelles de "S&R".
- Décalage en arrière : Permet de décaler la fenêtre d'analyse dans le passé. Utile pour tester comment les zones de densité historiques ont influencé les mouvements de prix ultérieurs.
- Pas de regroupement (Prix) : Le réglage le plus critique. Il définit la "sensibilité" de l'aimant.
- Source du prix : Choisissez quelle partie du chandelier analyser.
-
- Clôture : Analyse standard.
- Médiane / Typique : Souvent plus précis car il prend en compte toute la plage du chandelier.
- Niveaux à afficher : Définit combien de niveaux magnétiques dessiner (de 1 à 10). Le niveau le plus fréquent est toujours dessiné avec une ligne plus épaisse.
- Paramètres visuels (Afficher la zone/les lignes de densité) : Activez ou désactivez le rectangle de fond (Zone) et les lignes horizontales. La Zone représente les limites totales de l'action des prix analysée, offrant une visualisation claire de la plage de trading actuelle.
Conseils de stratégie de trading
- Reversion à la moyenne : Lorsque le prix s'écarte significativement de la "Ligne Magnétique Principale", recherchez des signaux d'épuisement pour trader un retour vers l'aimant.
- Confirmation de cassure : Si le prix franchit un niveau magnétique fort et le reteste, ce niveau se transforme souvent de résistance en support.
- Objectifs de prise de profit : Utilisez les niveaux magnétiques secondaires comme objectifs pour vos trades.
Price Magnet simplifie les données complexes du profil de marché en niveaux visuels exploitables, vous donnant un avantage professionnel dans toutes les conditions de marché.
Résumé
Key configurable parameters include analysis depth (short-term for scalping/day trading or long-term for major institutional zones), back shift for historical analysis, grouping step to adjust sensitivity (with recommended values for instruments like EURUSD, Gold, and Bitcoin), and price source selection (close, median, or typical price). Users can set the number of magnetic levels to display and toggle visual elements such as density zones and lines.
Price Magnet supports various markets including Forex pairs (EURUSD, GBPUSD, NZDUSD, USDJPY), commodities (Gold), cryptocurrencies (Bitcoin), and indices (US 30, NAS100, US 500). It aids trading strategies such as mean reversion, breakout confirmation, and setting take profit targets based on secondary magnetic levels. The tool simplifies complex market profile data into actionable visual levels to assist traders in identifying institutional support and resistance zones.
Avis clients
5 | 50 % | |
4 | 25 % | |
3 | 25 % | |
2 | 0 % | |
1 | 0 % |


