
Description
HiLo Marker : Découvrez les points de retournement clés du marché
HiLo Marker est un indicateur cTrader intuitif et essentiel conçu pour détecter et mettre en évidence automatiquement les plus hauts et les plus bas significatifs des prix sur une fenêtre historique définie. Cet outil apporte de la clarté à vos graphiques en éliminant les conjectures dans l’identification des points de retournement, offrant un avantage visuel à tout trader d’action de prix.
Comment ça fonctionne
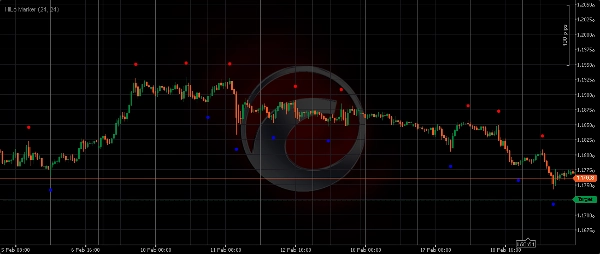
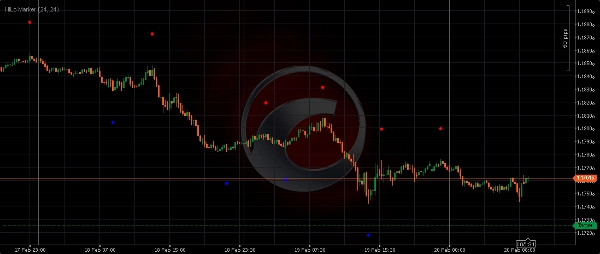
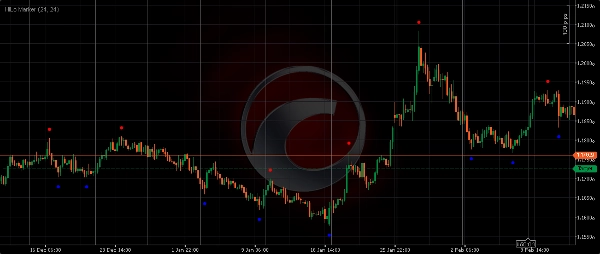
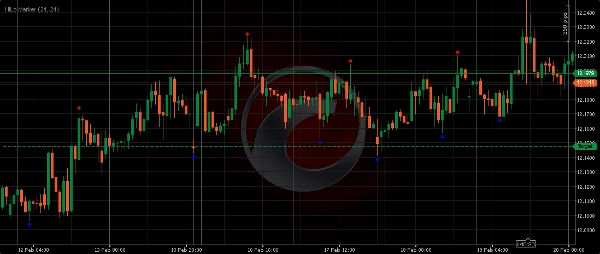
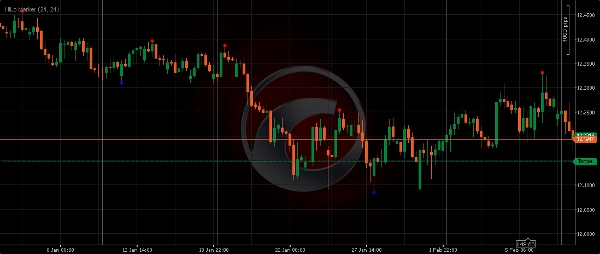
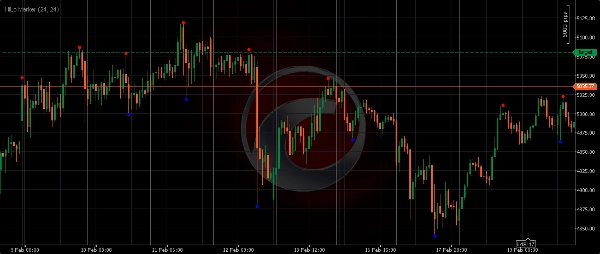
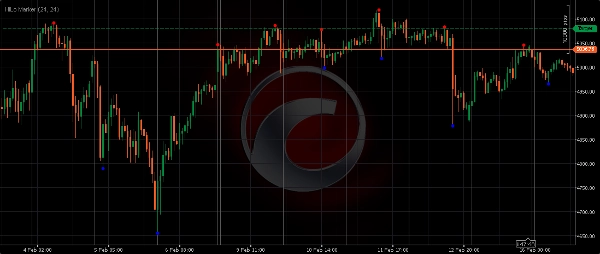
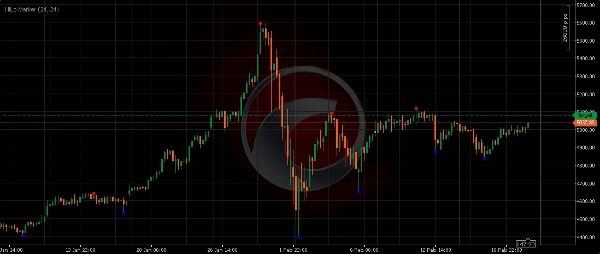
L’indicateur analyse une « Fenêtre de Distance » spécifiée (nombre de barres) pour trouver le plus haut absolu et le plus bas absolu dans cette plage. Une fois qu’une barre est confirmée comme étant le sommet ou le creux de sa fenêtre environnante, HiLo Marker place un point distinct rouge ou bleu (ou une flèche) au-dessus/en dessous de cette bougie. Cette méthode vous aide à identifier objectivement les niveaux cruciaux où le prix a précédemment inversé ou trouvé un fort élan.
Caractéristiques clés & avantages
- Précision automatisée : Fini le tracé manuel des lignes. HiLo Marker identifie objectivement les points de retournement critiques.
- Structure claire du marché : Visualisez instantanément les oscillations, tendances et plages, rendant l’analyse graphique plus efficace.
- Zones de support & résistance : Les hauts et bas marqués agissent fréquemment comme supports et résistances futurs, offrant des points d’entrée/sortie à haute probabilité.
- Polyvalent : Fonctionne parfaitement sur tous les instruments financiers (Forex, Or, Indices, Crypto, Actions) et sur n’importe quelle unité de temps.
- Visuels personnalisables : Ajustez les couleurs des marqueurs et la distance de décalage pour une intégration parfaite au graphique.
Paramètres d’entrée expliqués :
- Longueur (Décalage) : Cette valeur détermine à quelle distance au-dessus du plus haut ou en dessous du plus bas le marqueur sera placé. Une valeur plus grande crée une séparation visuelle plus importante par rapport à la bougie.
-
- Exemple :
Length = 24signifie que le marqueur apparaîtra à 24 pips (ou ticks, selon le symbole) du plus haut/bas réel.
- Exemple :
- Fenêtre de distance : Il s’agit de la période de retour en arrière que l’indicateur utilise pour identifier un plus haut ou un plus bas. Une barre n’est marquée comme Hi/Lo que si elle est le plus haut/le plus bas absolu dans ce nombre spécifié de barres environnantes.
-
- Plus petit
Dist(par ex., 10-20) : Capture les oscillations mineures et le bruit de marché à court terme (adapté au scalping). - Plus grand
Dist(par ex., 30-60+) : Identifie des oscillations plus importantes, de niveau institutionnel, et des retournements majeurs de tendance (idéal pour le swing trading ou les unités de temps supérieures).
- Plus petit
Améliorez votre trading d’action de prix avec HiLo Marker. Obtenez une perspective plus claire de la dynamique du marché et prenez des décisions plus éclairées. Téléchargez maintenant !
Résumé
Avis clients
5 | 0 % | |
4 | 100 % | |
3 | 0 % | |
2 | 0 % | |
1 | 0 % |


