Pulse Radar : Analyse professionnelle de la dynamique du momentum et des cycles
L’indicateur Pulse Radar est une suite analytique avancée pour les plateformes basées sur C#, conçue pour décoder la volatilité du marché et identifier les phases de développement des prix à haute probabilité. Contrairement aux indicateurs traditionnels retardés, Pulse Radar utilise une évaluation adaptative des zones d’équilibre des prix, fournissant une carte structurelle claire du marché.
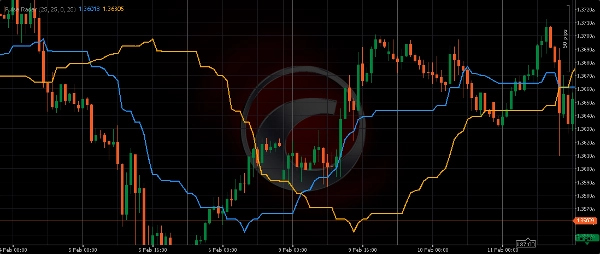
Le système construit deux courbes analytiques propriétaires :
- Vecteur Actif (Rapide) : Une ligne à haute réactivité reflétant le momentum immédiat et les variations de liquidité à court terme.
- Vecteur Stratégique (Lent) : Une courbe lissée représentant le cycle dominant du marché et l’équilibre des prix institutionnels.
En analysant la position du prix par rapport à ces courbes, les traders peuvent identifier avec précision la phase actuelle du marché dans une hiérarchie cyclique plus large. Pulse Radar offre également un alignement historique avancé, permettant une comparaison directe entre les mouvements structurels actuels et les schémas comportementaux passés.
Méthodologie technique
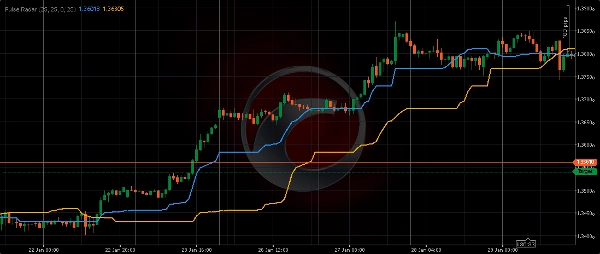
- Analyse des points extrêmes : Les lignes sont calculées à partir des extrêmes bruts des prix dans des fenêtres de recul spécifiques, éliminant le bruit présent dans les moyennes mobiles standard.
- Synchronisation de phase : L’algorithme supporte des ajustements de décalage manuels et automatiques pour aligner les données avec des segments historiques du graphique.
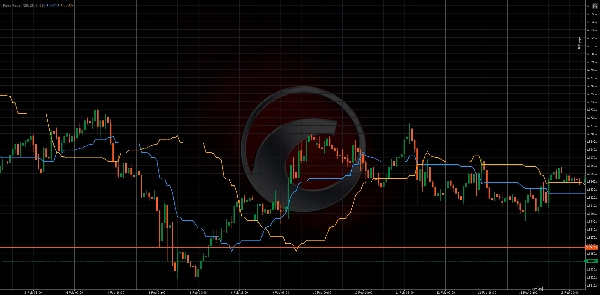
- Interaction structurelle : La convergence et la divergence des vecteurs Actif et Stratégique mettent en évidence les transitions entre les phases d’accumulation et de distribution de la tendance.
Avantages clés
- Précision sans lissage : Les calculs utilisent des données brutes du marché, garantissant qu’aucun retard artificiel n’est introduit.
- Cadre adaptatif : Paramètres entièrement configurables pour correspondre au profil de volatilité spécifique de tout actif.
- Utilité multi-marchés : Optimisé pour le Forex haute fréquence, les actions américaines, les matières premières et les cryptomonnaies.
- Architecture haute performance : Une logique C# légère assure une stabilité totale de la plateforme même en période de forte volatilité.
Paramètres d’entrée
- Période de portée (Rapide/Lent) : Définit la profondeur des données de marché utilisées pour calculer les vecteurs de momentum.
- Décalage de phase (Rapide/Lent) : Permet un calibrage précis des lignes analytiques par rapport aux structures de prix historiques.
5 | 100 % | |
4 | 0 % | |
3 | 0 % | |
2 | 0 % | |
1 | 0 % |