
说明
HiLo 标记器:揭示关键市场转折点
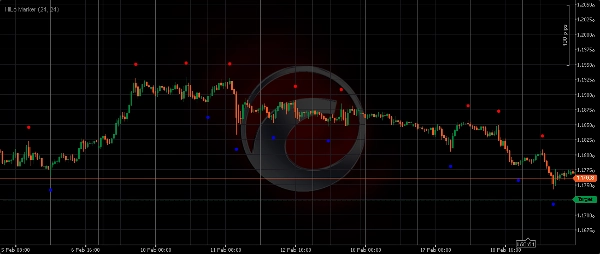
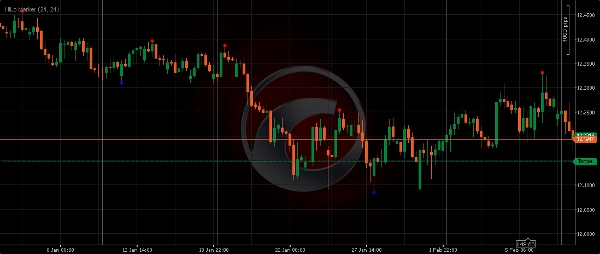
HiLo 标记器 是一个直观且必不可少的 cTrader 指标,旨在根据定义的历史窗口自动检测并突出显示重要的价格高点和低点。该工具通过消除识别波动点的猜测,为您的图表带来清晰度,为任何价格行为交易者提供视觉优势。
工作原理
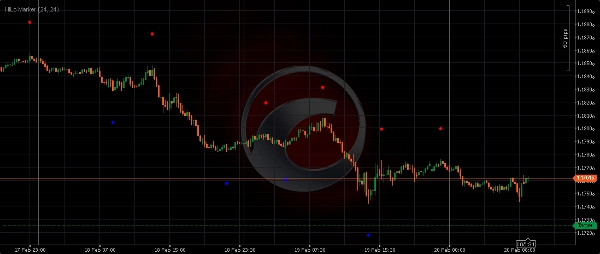
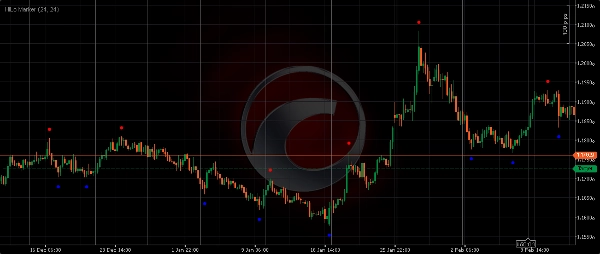
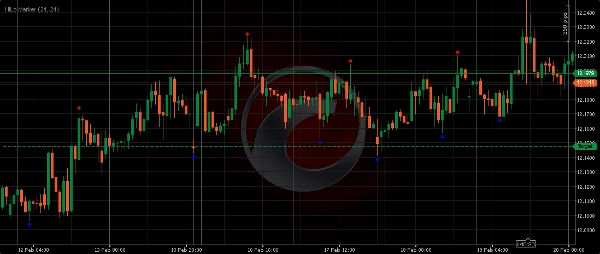
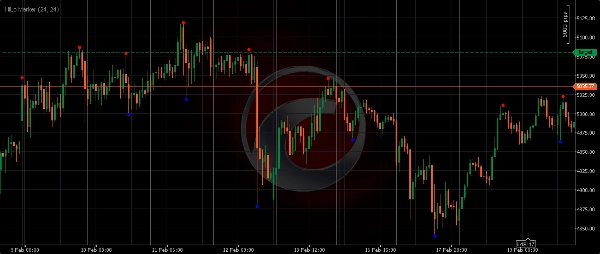
该指标扫描指定的“距离窗口”(柱数),以找到该范围内的绝对最高高点和最低低点。一旦某根柱被确认是其周围窗口的峰值或谷值,HiLo 标记器 会在该蜡烛的上方或下方放置一个明显的红色或蓝色点(或箭头)。这种方法帮助您客观地确定价格先前反转或获得强劲动能的关键水平。
主要特点与优势
- 自动精确: 不再需要手动绘制线条。HiLo 标记器客观地识别关键转折点。
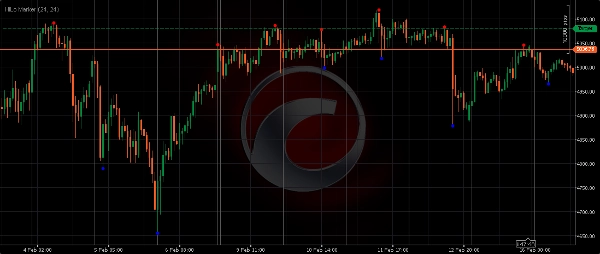
- 清晰的市场结构: 即时可视化波动、趋势和区间,使图表分析更高效。
- 支撑与阻力区域: 标记的高点和低点常常作为未来的支撑和阻力,提供高概率的进出场点。
- 多功能: 在所有金融工具(外汇、黄金、指数、加密货币、股票)及任何时间框架上均能完美运行。
- 可定制的视觉效果: 调整标记颜色和偏移距离,实现完美的图表集成。
输入参数说明:
- 长度(偏移): 此值决定标记将绘制在高点上方还是低点下方的距离。较大的值会使标记与蜡烛之间有更明显的视觉分离。
-
- 示例:
Length = 24意味着标记将出现在距离实际高点/低点 24 点(或滴答,取决于符号)的位置。
- 示例:
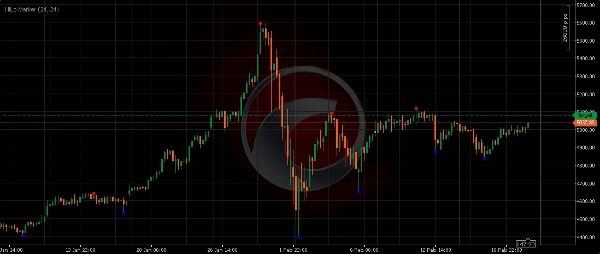
- 距离窗口: 这是指标用来识别高点或低点的回溯周期。只有当某根柱是该指定数量周围柱中绝对最高或最低时,才会被标记为高点/低点。
-
- 较小的
Dist(例如,10-20): 捕捉小幅波动和短期市场噪音(适合剥头皮交易)。 - 较大的
Dist(例如,30-60+): 识别更重要的机构级波动和主要趋势反转(适合波段交易或更高时间框架)。
- 较小的
使用 HiLo 标记器提升您的价格行为交易。获得更清晰的市场动态视角,做出更明智的决策。立即下载!
摘要
指标配置
客户评价
4.0
评价:2
5 | 0 % | |
4 | 100 % | |
3 | 0 % | |
2 | 0 % | |
1 | 0 % |
客户评价
February 21, 2026
the signal still needs a chart check, no surprise there. Demo first makes more sense.
February 21, 2026
Half size is enough at the start, and the poor entries show up earlier.
讨论
常见问答
BTCUSD
Fibonacci
Signal
ZigZag
Scalping
EURUSD
GBPUSD
NZDUSD
SMC
XAUUSD
NAS100
USDJPY
cTrader Store 提供的所有产品,包括交易机器人、指标和插件,均由第三方开发者提供,仅供信息参考和技术访问之用。cTrader Store 并非经纪商,不提供投资建议、个人推荐或任何未来业绩保证。


猜您喜欢


价格
注册日期 17/02/2026