Description
Biais de structure Heikin Ashi (Indicateur cTrader)
Zones d’offre et de demande automatiques avec biais multi-échelles.
Ce que cela fait – en termes simples
Cet indicateur fait automatiquement :
- Lit l’action des prix Heikin Ashi et détecte les changements de pivot significatifs.
- Construit des zones dynamiques de support et de résistance autour de ces pivots, en utilisant à la fois l’extrémité de la mèche et le corps de la bougie (pas seulement des lignes aléatoires).
- Fusionne intelligemment les zones proches pour que vous voyiez des niveaux clairs et exploitables au lieu d’une forêt de lignes horizontales.
- Génère un biais clair haussier ou baissier chaque fois que le prix casse complètement la dernière zone de support ou de résistance.
- Vous montre le biais pour :
-
- Votre échelle de temps du graphique, et
- Une échelle de temps supérieure optionnelle (par défaut H2) — sans encombrer votre graphique avec des éléments HTF.
Résultat : d’un seul coup d’œil, vous savez où se trouvent les vrais niveaux et si le marché penche actuellement à la hausse ou à la baisse.
Le problème qu’il résout
La plupart des traders rencontrent les mêmes problèmes :
- Les lignes de support/résistance tracées à la main sont :
-
- subjectives,
- incohérentes,
- et souvent exagérées.
- Les indicateurs simples “zigzag + ligne horizontale” :
-
- ne gèrent pas correctement la largeur des zones,
- empilent les niveaux les uns sur les autres,
- ou étendent les zones au point de couvrir la moitié du graphique.
- Le biais est souvent “dans votre tête” – pas quelque chose que vous pouvez clairement voir ou utiliser de manière basée sur des règles.
Cet indicateur est conçu pour :
- Transformer la structure Heikin Ashi en zones claires et objectives,
- Vous donner un biais/tendance basé sur des règles fondé sur ces zones,
- Tout en gardant le graphique propre et lisible.
Comment les zones sont construites (explication conviviale pour trader)
Pour chaque pivot Heikin Ashi, l’indicateur regarde une structure de 3 bougies :
- Quand HA passe du rouge au vert, il marque un pivot de support.
- Quand HA passe du vert au rouge, il marque un pivot de résistance.
Puis il construit la zone :
Zones de support
- Trouve la mèche la plus basse parmi les 3 bougies (vrai extrême).
- Trouve le plus bas suivant qui est encore plus haut que cet extrême.
- Utilise le corps de la bougie (ouverture/fermeture) près de ce bas interne pour définir le côté “exploitable” de la zone.
- Zone de support finale :
-
- Bas = extrême de la mèche basse,
- Haut = niveau interne basé sur le corps.
Zones de résistance
- Trouve la mèche la plus haute parmi les 3 bougies.
- Trouve le plus haut suivant qui est encore plus bas que cet extrême.
- Utilise le corps près de ce haut interne.
- Zone de résistance finale :
-
- Haut = extrême de la mèche haute,
- Bas = niveau interne basé sur le corps.
Ainsi, chaque zone n’est pas juste une bande arbitraire :
C’est une plage mèche-corps qui représente où le prix a vraiment rejeté ou inversé.
Logique de fusion (pourquoi le graphique reste propre)
Les zones du même type (support avec support, résistance avec résistance) :
- Sont traitées comme des unités sur une ligne temporelle.
- Ne peuvent fusionner que si elles se chevauchent réellement en prix.
- La fusion est strictement locale :
-
- Une nouvelle zone peut fusionner avec :
-
- la zone la plus récente (consécutive), ou
- la deuxième zone la plus récente (+1 écart), et
- Une fusion “ancre” supplémentaire derrière cela si la nouvelle zone combinée chevauche maintenant la structure précédente.
Cela garde le comportement intuitif :
- Les zones ne “avalent” pas tout l’historique.
- Les anciens niveaux sont respectés mais ne peuvent pas créer de méga-zones géantes.
- La structure locale comme A–B–C ou A–C+D est gérée de manière contrôlée.
Logique du biais (comment vous tradez réellement avec)
Pour chaque échelle de temps (principale et HTF) :
- L’indicateur suit la dernière zone de support fusionnée et la dernière zone de résistance fusionnée.
- Puis, à chaque bougie fermée :
-
- Si le prix ferme au-dessus de la dernière zone de résistance → le biais devient Haussier.
- Si le prix ferme en dessous de la dernière zone de support → le biais devient Baissier.
Il stocke :
- Le moment du dernier changement de biais,
- Le niveau de prix auquel le prix a cassé la zone.
Sur le graphique, un petit panneau de texte affiche :
Biais principal (H1) : HaussierChangement principal (H1) : 26/11 15:00 @1.08750
Si le HTF est activé, vous verrez aussi quelque chose comme :
Biais HTF (H2) : BaissierChangement HTF (H2) : 25/11 08:00 @1.09200
Vous pouvez aussi activer une alerte sonore lorsque le biais de l’échelle de temps principale change.
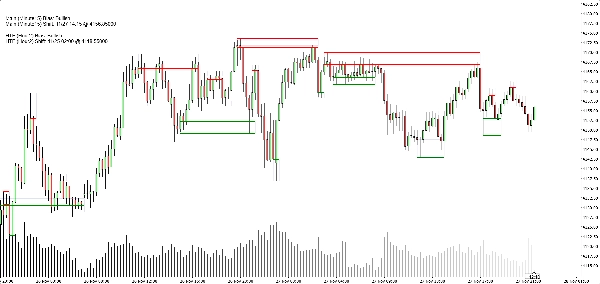
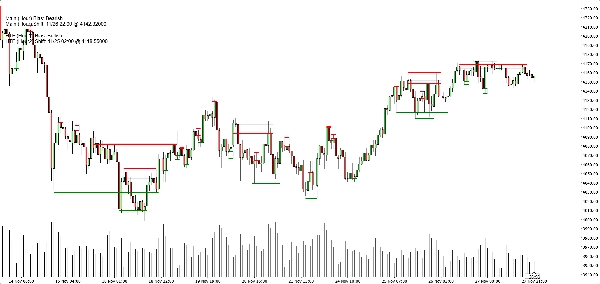
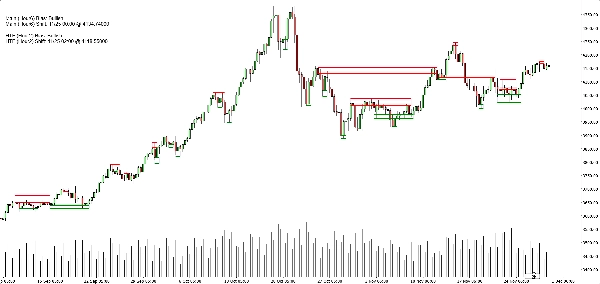
Ce que vous voyez sur le graphique
- Zones de support :
-
- Lignes de base/trigger horizontales vertes (optionnelles),
- Un rectangle bleu marine doux (opacité très faible) montrant toute la bande de support.
- Zones de résistance :
-
- Lignes rouges + rectangle bleu marine doux pour la bande.
- Options d’affichage épuré :
-
- Afficher/masquer les zones de support,
- Afficher/masquer les zones de résistance,
- Activer/désactiver les rectangles remplis,
- Activer/désactiver les lignes de base/trigger,
- Activer/désactiver le panneau de biais.
Cela permet aux différents traders de choisir entre :
- Un look plus minimaliste (peut-être juste des rectangles), ou
- Une vue plus précise (lignes exactes visibles).
Cas d’utilisation typiques
Vous pouvez le positionner comme utile pour :
- Filtrage de tendance
-
- Ne chercher des achats que lorsque les deux biais TF principal et HTF sont haussiers.
- Ne chercher des ventes que lorsque les deux sont baissiers.
- Entrées en zone
-
- Utiliser les zones comme zones d’intérêt pour :
-
- Ordres limités,
- Entrées de confirmation (ex. le prix revient dans une zone cassée et rejette à nouveau),
- Placement du stop juste au-delà de la bande extérieure.
- Analyse descendante
-
- Biais HTF (H2 par défaut) comme vue d’ensemble,
- Biais TF graphique pour le timing,
- Zones pour des niveaux d’exécution concrets.
Ce que ce n’est PAS (important pour une vente honnête)
- Ce n’est pas un robot qui trade automatiquement pour vous.
- Ce n’est pas un signal “saint graal” qui garantit un profit.
- C’est un moteur de structure et de biais :
-
- Définit objectivement les zones,
- Définit objectivement la tendance/le biais basé sur ces zones,
- Laisse la gestion réelle des trades au trader/stratégie.
Résumé
It provides a rule-based bullish or bearish bias by tracking price breaks above resistance or below support zones on both the current chart timeframe and an optional higher timeframe. This bias is displayed on a built-in dashboard panel, with optional sound alerts for bias changes.
The indicator works across all timeframes and markets where price forms swings, including forex, crypto, stocks, and futures. It features customizable lookback periods, automatic cleanup of old zones, and toggles for display elements to suit different trader preferences.
Typical uses include trend filtering by aligning biases across timeframes, identifying zone entries for limit or confirmation orders, and supporting top-down analysis. The tool timestamps and sequences pivots and bias shifts, facilitating automation or journaling. It is a structure and bias engine that aids traders in objectively defining market levels and trends while maintaining chart clarity.
Avis clients
5 | 33 % | |
4 | 67 % | |
3 | 0 % | |
2 | 0 % | |
1 | 0 % |