
Pivot Points Clasic,FIBO,etc
Gösterge
828 i̇ndirmeler
Sürüm 1.0, Jul 2025
Windows, Mac
Açıklama
Pivot Points Özelleştirilebilir — cTrader için Nihai Hepsi Bir Arada Pivot Göstergesi
Profesyonel fiyat hareketi analizinin gücünü çok yönlü bir araçla açığa çıkarın!
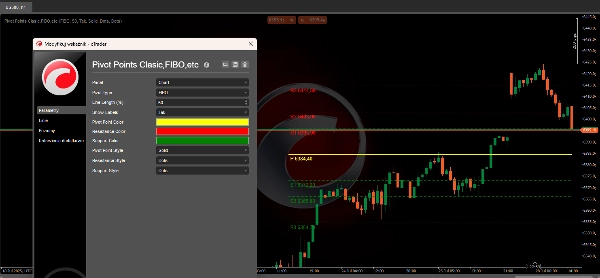
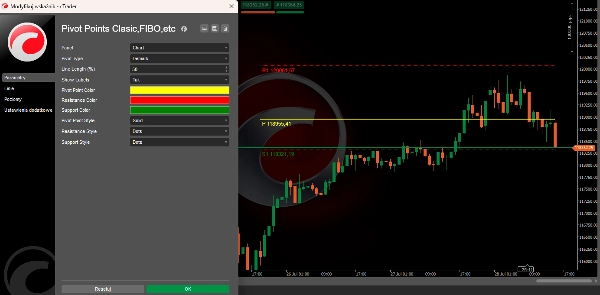
Pivot Points Özelleştirilebilir, cTrader için gelişmiş, son derece esnek bir göstergedir ve tüm önemli pivot hesaplama yöntemlerini parmaklarınızın ucuna getirir — size net destek/direnç seviyeleri, özel stil ve akıllı grafik etiketleme sunar.
Ana Özellikler:
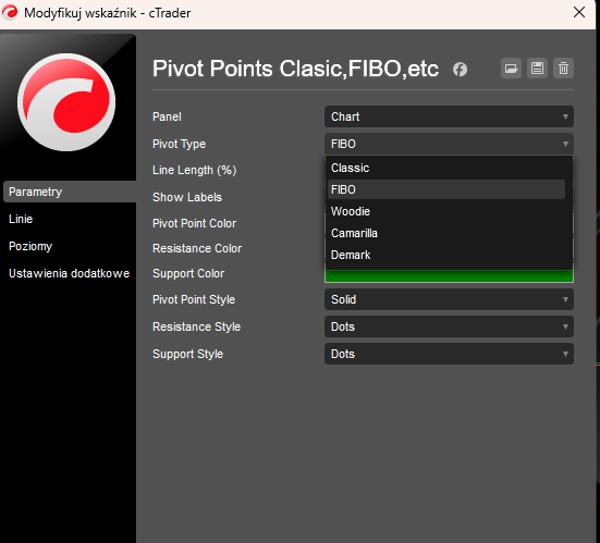
- Bir Arada 5 Pivot Yöntemi:
Klasik, Fibonacci, Woodie, Camarilla ve Demark formülleri arasında anında geçiş yapın. Tüm ticaret stilleri için mükemmel: scalping, günlük işlem ve swing trading. - Tam Özelleştirme:
-
- Pivot hesaplama yönteminizi seçin.
- Pivot, direnç ve destek seviyeleri için özel renkler ve çizgi stilleri ayarlayın.
- Temiz, dağınıklıktan uzak görseller için görünür çizgi uzunluğunu grafiğinizin yüzdesi olarak ayarlayın.
- Her pivot için gerçek zamanlı fiyat seviyelerini gösteren akıllı etiketleri açıp kapatın.
- Profesyonel Grafik Üstü Yerleştirme:
Pivotları ve destek/direnç seviyelerini fiyat grafiğinizin üzerine doğrudan çizer, yeni barlar göründükçe otomatik güncellenir.
Her yöntem için desteklenen seviyeler: -
- Klasik, Fibo, Woodie: 3–4 direnç (R1–R4) ve destek (S1–S4) seviyesine kadar
- Camarilla: 4 direnç ve destek seviyesine kadar
- Demark: Özel benzersiz seviyeler (sadece R1, S1 ve Pivot)
- Şimşek Hızı ve Hafif:
Gerçek zamanlı performans için optimize edilmiştir — gecikme yok, dış kütüphane yok, %100 yerel cTrader kodu. - Tüm Piyasalar İçin İdeal:
Forex, endeksler, emtialar, kripto ve daha fazlasıyla mükemmel çalışır!
Neden Pivot Points Özelleştirilebilir'i seçmelisiniz?
- Birden fazla strateji, tek araç: Pivotlar arasında bir tıkla geçiş yapın — hangi piyasanıza uygun olduğunu test edin!
- Ana seviyeleri anında görün:
Fiyat dönüşlerinin veya kırılmaların en olası olduğu bölgelere anında erişim. - Nihai grafik netliği:
Çizgiler grafik penceresine otomatik uyum sağlar — artık karışık veya üst üste binen göstergeler yok. - Ticaret güveninizi artırın:
Kuruluşların ve profesyonellerin her seansta fiyatı nerede izlediğini bilin.
Bugün daha iyi ticaret kararları verin. Pivot Points Özelleştirilebilir'i deneyin — ve teknik analizinizdeki farkı görün!
Özet
YZ özeti
Pivot Points Customizable is a versatile indicator designed for the cTrader platform that integrates five major pivot point calculation methods: Classic, Fibonacci, Woodie, Camarilla, and Demark. It provides traders with clear support and resistance levels directly overlaid on price charts, updating automatically as new bars form. Users can fully customize the indicator by selecting pivot calculation methods, adjusting colors and line styles for pivot, resistance, and support levels, and setting line lengths relative to the chart window to maintain visual clarity. Smart labels displaying real-time price levels for each pivot can be toggled on or off. The indicator supports multiple resistance and support levels depending on the method chosen—up to four for Classic, Fibonacci, Woodie, and Camarilla, and unique levels for Demark. Optimized for real-time performance with native cTrader code, it operates without lag or external dependencies. This tool is suitable for various trading styles including scalping, day trading, and swing trading, and is compatible with multiple markets such as Forex, indices, commodities, and cryptocurrencies. It aims to assist traders in identifying key price levels where reversals or breakouts are likely, enhancing technical analysis and decision-making.
Gösterge profili
Müşteri değerlendirmeleri
0.0
Değerlendirmeler: 0
Müşteri değerlendirmeleri
Bu ürün için henüz bir değerlendirme yok. Ürünü denediniz mi? O zaman ona dair görüşlerini paylaşan ilk kişi olun!
Tartışma
SSS
cTrader Store üzerinden erişilebilen işlem botları, göstergeler ve eklentiler gibi ürünler, üçüncü taraf sağlayıcılar tarafından sağlanır ve yalnızca bilgilendirme ve teknik erişim amaçlarıyla sunulur. cTrader Store bir broker değildir ve yatırım tavsiyesi, kişisel öneriler vermez veya gelecekteki performansı garanti etmez.


Fiyat
Başlangıç 26/06/2025
59.07M
İşlem hacmi
965.98K
Kazanılan pip
828
Ücretsiz yüklemeler