
Daily TPO profile
Gösterge
212 i̇ndirmeler
Sürüm 1.0, Nov 2025
Windows, Mac
Açıklama
Günlük TPO Profili
Her oturum için POC, VAH ve VAL hesaplayan günlük TPO profil göstergesi.
Kontrol Noktasını ve %70 Değer Alanını doğrudan grafikte çizer, adil değer bölgelerini, önemli destek/direnç seviyelerini ve potansiyel fiyat reddi veya kabul alanlarını belirlemenize yardımcı olur.
Nasıl çalışır
Bu gösterge, bir günlük TPO (Zaman Fiyat Fırsatı) profili oluşturur, Market Profili'ne benzer.
Ticaret gününün her çubuğu için:
- fiyat eksenini “Satır Boyutu (pip)” ile tanımlanan sabit “adımlara” böler
- her fiyat adımı için, o seviyeye kaç çubuğun dokunduğunu sayar (TPO = fiyatın orada kaç kez işlem gördüğü)
- günün sonunda şunları hesaplar:
-
- POC (Kontrol Noktası) → en yüksek TPO sayısına sahip fiyat seviyesi (piyasanın en çok zaman geçirdiği yer)
- VAH (Değer Alanı Yüksek) ve VAL (Değer Alanı Düşük) → o oturum için tüm TPO'ların yaklaşık Değer Alanı %'sini (varsayılan %70) içeren fiyat seviyeleri
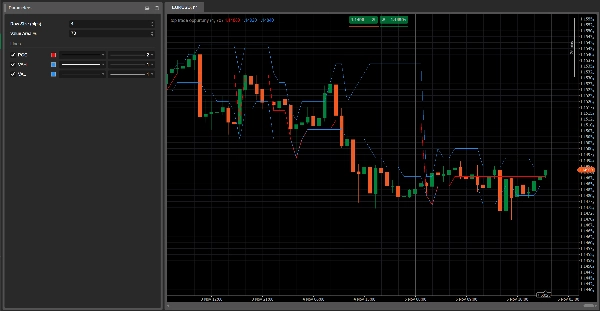
Gösterge, grafikte üç yatay çizgi çizer:
- Kırmızı çizgi → POC
- Mavi çizgiler → VAH (üst) ve VAL (alt)
Bu çizgiler oturum boyunca çubuk çubuk güncellenir ve yeni bir ticaret günü başladığında sıfırlanır.
Ana parametreler
Satır Boyutu (pip)
Profildeki her fiyat adımının kalınlığını tanımlar.-
- Daha küçük değerler = daha detaylı profil
- Daha büyük değerler = daha düzgün profil
Değer Alanı %
Değer Alanı içinde bulunan toplam TPO'ların yüzdesi (genellikle %70).
Değer Alanı, gün boyunca piyasa aktivitesinin çoğunun gerçekleştiği fiyat bölgesidir.
Nasıl okunur
- POC (kırmızı çizgi)
-
- O gün piyasa tarafından en çok “kabul edilen” fiyat seviyesi.
- Çoğunlukla bir denge seviyesi olarak işlev görür: fiyat bu bölgede sıçrayabilir, durabilir veya güçlü bir şekilde kırılabilir.
- Değer Alanı (VAH–VAL, mavi çizgiler)
-
- Çoğu işlemin gerçekleştiği “adil değer” bölgesini temsil eder.
- Fiyat hareketi VAH/VAL'ye göre şunları gösterebilir:
-
- Aşırı fiyatların reddi (VAH/VAL ötesinde sahte kırılmalar)
- Yeni fiyatların kabulü (Değer Alanı dışında konsolidasyon)
Tipik kullanım fikirleri
- Fiyat VAL'yi reddeder ve Değer Alanı içine geri döner → “adil değere” dönüşe (ortalama dönüş) bahis yapan potansiyel uzun pozisyon fikri.
- Fiyat VAH'nin üzerine güçlü bir şekilde çıkar ve üstünde yapı oluşturmaya başlar → potansiyel olarak yeni daha yüksek bir değer alanı başlangıcı (trend takip senaryosu).
- POC'lerin birkaç gün aynı seviyede olması → güçlü denge/birikim bölgesi, genellikle önemli destek/direnç.
Özet
YZ özeti
The Daily TPO Profile indicator constructs a daily Time Price Opportunity (TPO) profile similar to a Market Profile, analyzing market activity by price levels throughout each trading session. It divides the price axis into fixed increments ("Row Size" in pips) and counts how many bars traded at each price step, representing TPOs. At the end of the session, it calculates three key levels: the Point of Control (POC), where the market spent the most time; the Value Area High (VAH); and the Value Area Low (VAL), which together define the price range containing approximately 70% of the trading activity.
The indicator plots these levels as horizontal lines on the chart—POC in red, VAH and VAL in blue—updating them bar by bar during the session and resetting daily. Traders use the POC as an equilibrium price level that may act as support or resistance. The Value Area highlights fair value zones, with price action near VAH and VAL signaling potential rejection or acceptance of price extremes. Typical applications include identifying mean reversion opportunities when price rejects VAL or trend-following setups when price breaks above VAH.
Main adjustable parameters include Row Size (pips), controlling profile detail, and Value Area %, defining the percentage of TPOs included in the value area. The indicator supports analysis across various markets including forex, indices, commodities, stocks, and cryptocurrencies.
Gösterge profili
Müşteri değerlendirmeleri
0.0
Değerlendirmeler: 0
Müşteri değerlendirmeleri
Bu ürün için henüz bir değerlendirme yok. Ürünü denediniz mi? O zaman ona dair görüşlerini paylaşan ilk kişi olun!
Tartışma
SSS
Signal
Indices
Commodities
GBPUSD
RSI
Bollinger
Fibonacci
Scalping
AI
XAUUSD
NAS100
MACD
BTCUSD
Forex
Breakout
EURUSD
NZDUSD
Martingale
Prop
ZigZag
Supertrend
Fair Value Gap
SMC
Crypto
Grid
Stocks
ATR
USDJPY
VWAP
cTrader Store üzerinden erişilebilen işlem botları, göstergeler ve eklentiler gibi ürünler, üçüncü taraf sağlayıcılar tarafından sağlanır ve yalnızca bilgilendirme ve teknik erişim amaçlarıyla sunulur. cTrader Store bir broker değildir ve yatırım tavsiyesi, kişisel öneriler vermez veya gelecekteki performansı garanti etmez.


!["[Hamster-Coder] Pivot Points MTF" logosu](https://cdn.ctrader.com/image/webp/4c143e5a-309c-40e3-a578-f04d1e133ffa_31159)


Fiyat
42.11M
İşlem hacmi
6.13M
Kazanılan pip
221
Satışlar
8.38K
Ücretsiz yüklemeler