MARCs_MARKET_OVERVIEW_LITE_XAUUSD
Gösterge
1 i̇ndirmeler
Sürüm 1.0, Aug 2026
Windows, Mac
Trading product for MARCs_MARKET_OVERVIEW_LITE_XAUUSD Gösterge Key Levels RSI, image 2
Trading product for MARCs_MARKET_OVERVIEW_LITE_XAUUSD Gösterge Key Levels RSI, image 3
Trading product for MARCs_MARKET_OVERVIEW_LITE_XAUUSD Gösterge Key Levels RSI, image 4
Trading product for MARCs_MARKET_OVERVIEW_LITE_XAUUSD Gösterge Key Levels RSI, image 5
Başlangıç 24/06/2026
1
Ücretsiz yüklemeler

Açıklama

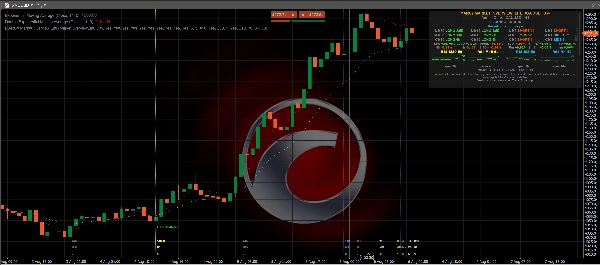
MARCs Market Overview Lite XAUUSD is a free, reduced-scope market overview indicator for cTrader.


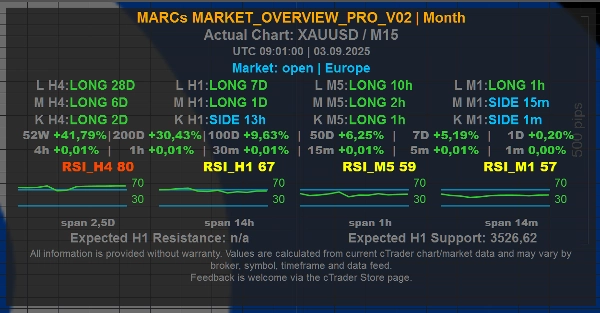
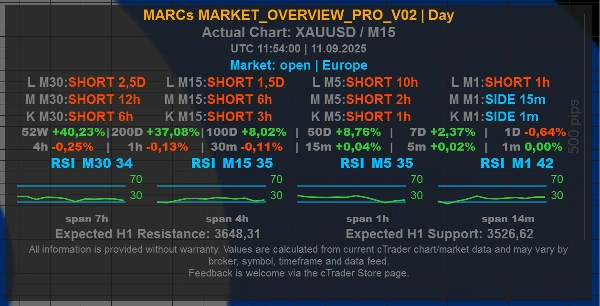
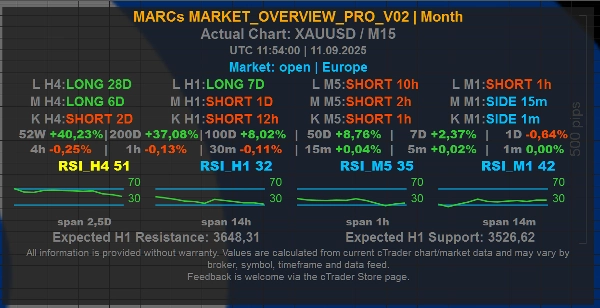
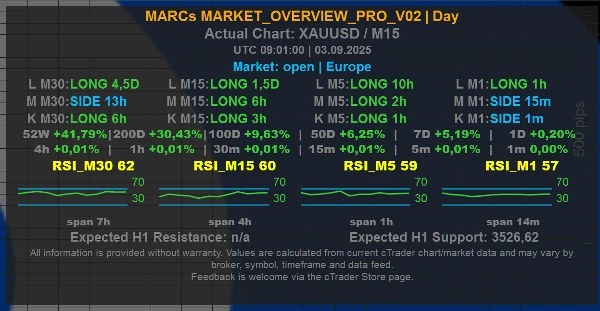
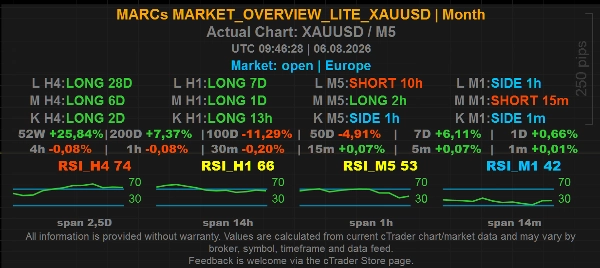
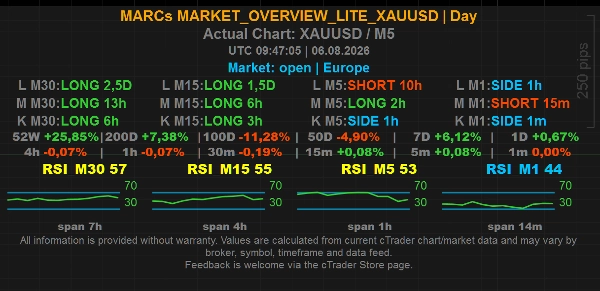
It displays a compact on-chart dashboard for XAUUSD / Gold charts with multi-timeframe trend context, RSI readings, market/session information, optional chart-level values and a simplified set of display controls.


This Lite edition is designed as a focused XAUUSD overview tool. It keeps the core panel workflow of MARCs Market Overview while using fixed internal settings and a limited preset selection.


Main features:

- Free Lite edition for XAUUSD charts

- Compact on-chart market overview panel

- Multi-timeframe trend rows for short, medium and long market context

- RSI values and mini RSI history across fixed internal timeframes

- Market/session line with UTC time

- Day and Month time-horizon presets

- Optional market line

- Optional H1 chart-level values shown directly in the panel

- Optional simplified H1 level lines on the chart

- Optional line labels, level origin markers and lookback markers

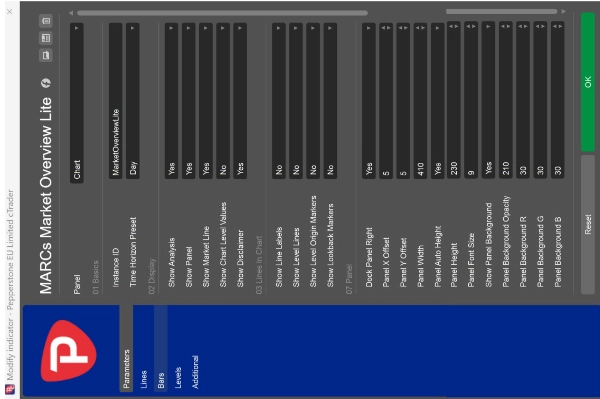
- Fully adjustable panel position, width, height, font size and background appearance


Lite edition limitations:

- Works on XAUUSD charts only

- Time Horizon Preset is limited to Day and Month

- Trend rows use fixed internal timeframe and candle settings

- RSI display uses fixed internal settings

- Time display uses fixed internal settings

- Chart level values are limited to H1

- Chart level lines are available as a simplified on/off option and use fixed H1 levels

- Some advanced customisation options from the Pro version are not included


If the indicator is attached to another symbol, the panel shows a clear XAUUSD-only notice instead of displaying overview values.


Level Lines and Chart Level Values:

The optional Show Level Lines setting can display calculated H1 chart reference levels. In the Lite edition, this is simplified to an on/off option. When enabled, the indicator shows the nearest calculated resistance above the current price and the nearest calculated support below the current price.


The optional Show Chart Level Values setting can show the same nearest H1 resistance/support reference values directly in the panel without drawing lines on the chart. The panel line is labelled, for example, "Chart Levels H1 | R ... | S ..." to make clear that the values refer to chart-level references.


How Level Lines are calculated:

The levels are derived from past swing highs and swing lows in the selected internal timeframe. Nearby swing points are grouped into level clusters, and only areas with enough repeated touches are shown. This makes the lines visual market-context markers based on available chart history.


What Level Lines do not mean:

Level Lines are not buy signals, sell signals, stop-loss recommendations, take-profit recommendations or investment advice. They do not predict that price will reverse, break out or react at a specific level.


About the Pro version:

MARCs Market Overview Pro offers broader symbol use, more time-horizon presets and more detailed customisation options. The Lite XAUUSD edition is a free, focused version for traders who want a simpler Gold/XAUUSD market overview panel.


Important:

MARCs Market Overview Lite XAUUSD is an analysis-only market overview tool. It does not place trades, manage positions, provide investment advice or guarantee trading results.


All readings depend on the available cTrader chart data, broker symbol feed, timeframe and market history. Values may differ between brokers, symbols and data feeds.


Trading involves risk. Past performance does not guarantee future results.


Özet

YZ özeti
MARCs Market Overview Lite XAUUSD is a market overview indicator designed for cTrader, focused exclusively on XAUUSD (Gold) charts. It provides a compact on-chart dashboard displaying multi-timeframe trend context (short, medium, long), RSI values with mini history, and market/session information with UTC time. The indicator includes fixed Day and Month time-horizon presets and offers optional features such as market lines, H1 chart-level values, simplified H1 level lines, line labels, and level origin markers.
Level lines are calculated from past swing highs and lows on the H1 timeframe, highlighting key resistance and support clusters based on repeated price touches. These lines serve as visual market context markers but do not constitute trading signals or advice.
The panel’s position, size, font, and background appearance are fully adjustable. The Lite edition uses fixed internal settings and limited presets, restricting its use to XAUUSD charts only. It does not place trades or provide investment recommendations. This tool relies on available chart data and broker feeds, which may vary.
This edition offers a streamlined overview for Gold traders, with broader symbol support and customization available in the Pro version.
Gösterge profili
Gösterge kategorisi
Piyasa yapısı (SMC)
Çıktı türü
Görselleştirme
Filtre
Veri gereklilikleri
Yalnızca çubuklar
Desteklenen sinyaller
Trend gücü
Seviyeye dokunuş

Müşteri değerlendirmeleri

0.0
Değerlendirmeler: 0
Müşteri değerlendirmeleri
Bu ürün için henüz bir değerlendirme yok. Ürünü denediniz mi? O zaman ona dair görüşlerini paylaşan ilk kişi olun!

Tartışma

SSS

Key Levels
RSI
Market Structure
Risk Dashboard
Support & Resistance
cTrader Store üzerinden erişilebilen işlem botları, göstergeler ve eklentiler gibi ürünler, üçüncü taraf sağlayıcılar tarafından sağlanır ve yalnızca bilgilendirme ve teknik erişim amaçlarıyla sunulur. cTrader Store bir broker değildir ve yatırım tavsiyesi, kişisel öneriler vermez veya gelecekteki performansı garanti etmez.

Bu oluşturanın diğer ürünleri

cBot
Conservative
Fixed Risk %
+5
MARCs GOLD H4-Gold-Swing-Bot for XAUUSD with transparent long-term backtests and optional reserve/guard system.
3.01
Kâr faktörü
Gösterge
RSI
Key Levels
+3
MARCs Multi-timeframe market dashboard with trend rows, RSI context, sessions, presets and optional chart levels.

Şunları da beğenebilirsiniz

Gösterge
VWAP
Volume
+5
Institutional Session VWAP + 3-Sigma Bands & HUD. Engineered for high-precision Index & Prop Firm Scalping.
Gösterge
Forex
BTCUSD
+11
Visualize trends with Standard Deviation Channel! Display median, and add customizable upper/lower deviation channels.
"PMAX" logosu
En yüksek puanlı
5.0
(6)
Ücretsiz
Gösterge
ATR
Supertrend
It's a combination of two trailing stop loss and the other one is well-known ATR-based SuperTrend.
Gösterge
BOS
CHOCH
+3
Smart Money Concepts Pro v5.1 for cTrader is a structural market analysis indicator that identifies swings, BOS, CHoC
Gösterge
Forex
BTCUSD
+9
💥Detects moments when the market is "compressed" and about to explode in any direction 💥
Gösterge
The long awaited new and improved Supply Demand Premium V2 indicator. Unlock greater trading opportunities now!
Gösterge
AI
SMC
+11
Perfect Entry Price designed to help traders identify the most accurate and reliable price levels for market entries
Gösterge
ATR
RSI
+13
The TrendFibonacci indicator is a powerful tool for traders, combining Fibonacci retracement levels
Gösterge
Forex
BTCUSD
+8
The traditional Hull Moving Average with different colours based on the slope (direction) of the trend.
Gösterge
Liquidity Sweep
A complete system for NASDAQ The tool that separates traders who "guess" from traders who operate like a professional.
Gösterge
Prop
Forex
+11
A visual indicator designed to help traders identify and track market activity across different trading sessions.
Gösterge
Forex
Crypto
+2
HTF Candle
Gösterge
News Filter
External Data
+3
Real-time financial news and economic calendar overlay for cTrader with smart alerts
Gösterge
Prop
Forex
+12
Identify and trade breakouts with Consolidation Zones! Visualize price consolidation areas for trading opportunities.
Gösterge
RSI
MACD
+2
A straightforward yet effective tool signals entry points for both buying and selling. Include 3 Moving Average
Gösterge
EMA
SMA
+2
Smart volume analysis with BP detection, trend confirmation and breakout signals for professional traders.
Gösterge
BOS
CHOCH
+1
Maps unmitigated SMC swing points. Draws infinite structure lines until price touches them, labeling BOS & CHoCH breaks.
Gösterge
ATR
Breakout
Detects swing highs/lows, structure, breakouts, trend lines, and fibs — great for price action trading.

Fiyat

Başlangıç 24/06/2026
1
Ücretsiz yüklemeler