Beschreibung
3-Bar Umkehr
📊 WAS IST DAS?
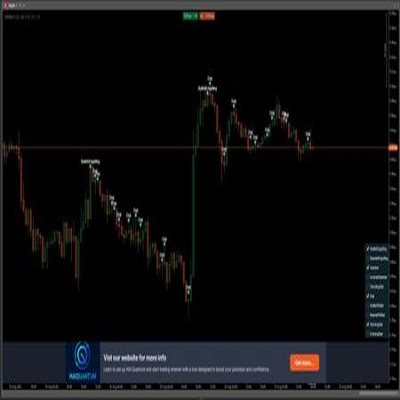
Der 3-Bar Umkehr ist ein technischer Indikator, der spezifische Umkehrmuster identifiziert, die aus genau drei aufeinanderfolgenden Kerzen bestehen. Dieses klassische Muster signalisiert potenzielle Richtungsänderungen des Preises durch eine klare visuelle Struktur: eine Trendkerze, eine Erschöpfungskerze und eine Umkehrkerze.
🎯 WOFÜR IST ES?
Dieser Indikator hilft Händlern dabei:
- Bullische und bärische Umkehrungen zu erkennen mit 3-Kerzen-Struktur
- Falsche Signale zu filtern durch konfigurierbare Trendbestätigung
- Unterstützungs- und Widerstandsbereiche zu identifizieren basierend auf bestätigten Mustern
- Handelsmöglichkeiten zu visualisieren mit intuitiven Chart-Markierungen
- Umkehrungen mit hoher Wahrscheinlichkeit zu handeln in jedem Zeitrahmen
🔍 WIE FUNKTIONIERT ES?
Bullisches Muster (3-Bar Bullische Umkehr)
Drei-Kerzen-Struktur:
- Kerze 1 (Bärisch): Schlusskurs unter Eröffnung - bestätigt Verkaufsdruck
- Kerze 2 (Erschöpfung bärisch): Macht neue Tiefs UND neue Hochs unter Kerze 1, mit bärischem Schlusskurs - Kapitulationssignal ⚠️
- Kerze 3 (Bullische Umkehr): Schlusskurs über Eröffnung UND Hoch über dem Hoch von Kerze 1 - bestätigt Kontrollwechsel ✅
Bärisches Muster (3-Bar Bärische Umkehr)
Gegenteilige Struktur:
- Kerze 1 (Bullisch): Schlusskurs über Eröffnung - bestätigt Kaufdruck
- Kerze 2 (Ausdehnung bullisch): Macht neue Hochs UND neue Tiefs über Kerze 1, mit bullischem Schlusskurs - Überdehnungssignal ⚠️
- Kerze 3 (Bärische Umkehr): Schlusskurs unter Eröffnung UND Tief unter dem Tief von Kerze 1 - bestätigt Kontrollwechsel ✅
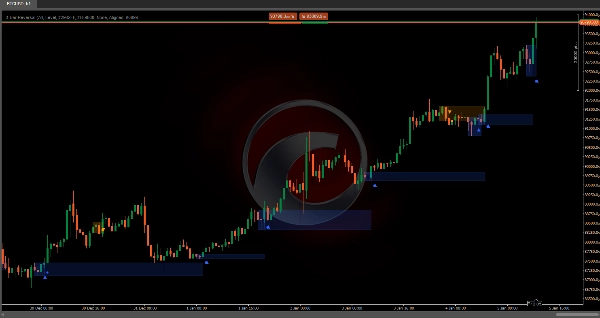
Visuelles Management-System (Zustandsmaschine)
Der Indikator verarbeitet jedes Muster in drei aufeinanderfolgenden Phasen:
PHASE 1 - MUSTERERKENNUNG: 🔍
- Die vollständige 3-Kerzen-Struktur wird identifiziert
- Ein Dreieck-Indikator (▲ bullisch / ▼ bärisch) erscheint auf der dritten Kerze
- Ein halbtransparenter Einstellungsrechteck wird gezeichnet und deckt ab:
-
- Bullisch: Vom Hoch der Kerze 1 bis zum niedrigsten Tief (Kerze 2 oder 3)
- Bärisch: Vom Tief der Kerze 1 bis zum höchsten Hoch (Kerze 2 oder 3)
- Dieses Rechteck markiert die "Kampfzone", in der die Umkehr stattfand
PHASE 2 - BESTÄTIGUNG ODER UNTERLASSUNG: ⏳
Das System wartet auf die nächste Kerze nach dem Muster, um es zu validieren:
Bullische Bestätigung: ✅
- Der Schlusskurs der nächsten Kerze muss das Hoch der Kerze 1 (Rechteck-Decke) überschreiten
- Ein fester Punkt (●) erscheint und markiert die Bestätigung
- Das Rechteck wird zu einer aktiven Unterstützungszone
Bärische Bestätigung: ✅
- Der Schlusskurs der nächsten Kerze muss das Tief der Kerze 1 (Rechteck-Boden) unterschreiten
- Ein fester Punkt (●) erscheint und markiert die Bestätigung
- Das Rechteck wird zu einer aktiven Widerstandszone
Ungültigmachung: ❌
- Bullisch schlägt fehl, wenn: Schlusskurs unter dem Rechteck-Minimum ODER ein bärisches Muster erscheint
- Bärisch schlägt fehl, wenn: Schlusskurs über dem Rechteck-Maximum ODER ein bullisches Muster erscheint
- Das Rechteck hört auf sich auszudehnen (Muster stirbt)
Warteausdehnung: ⏸️
- Wenn keine Bestätigung oder Fehlschlag vorliegt, dehnt sich das Rechteck kerzenweise horizontal aus
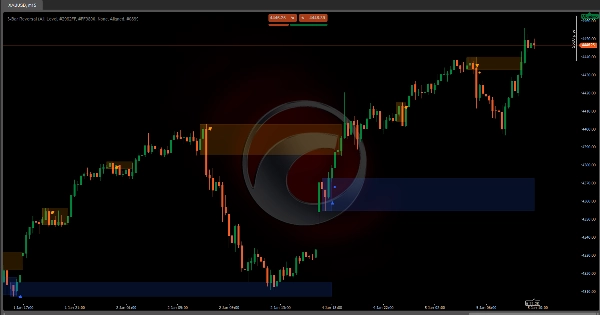
PHASE 3 - AKTIVE UNTERSTÜTZUNGS-/WIDERSTANDSZONE: 🎯
- Nach Bestätigung erstreckt sich die Zone unbegrenzt nach rechts
- Bullische Zone: Bleibt aktiv, solange der Preis über dem Boden bleibt
- Bärische Zone: Bleibt aktiv, solange der Preis unter der Decke bleibt
- Die Zone wird deaktiviert, wenn der Preis sie vollständig in die entgegengesetzte Richtung durchbricht
⚙️ HAUPTKONFIGURATION
Mustermodus
Steuert, welche Mustervariationen akzeptiert werden:
- Normal: Akzeptiert nur, wenn Kerze 3 INNERHALB der Spanne von Kerze 1 schließt
-
- Bullisch: Schlusskurs < Hoch von Kerze 1 (moderate Umkehr)
- Bärisch: Schlusskurs > Tief von Kerze 1 (moderate Umkehr)
- Erweitert: Akzeptiert nur, wenn Kerze 3 AUSSERHALB der Spanne von Kerze 1 schließt 🔥
-
- Bullisch: Schlusskurs > Hoch von Kerze 1 (explosive Umkehr)
- Bärisch: Schlusskurs < Tief von Kerze 1 (explosive Umkehr)
- Alle (Empfohlen): Akzeptiert beide Typen ohne Unterscheidung ⭐
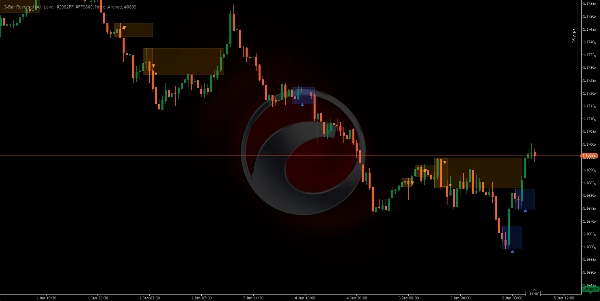
Typ der Unterstützung/Widerstand
- Level: Grundlegende Linienfunktionalität (begrenzt in dieser Version)
- Zone: Zeichnet schattierte Rechtecke, die SR-Zonen nach Bestätigung markieren 📦
- Keine: Keine SR-Zonen, zeigt nur erkannte Muster
Anpassbare Farben 🎨
- Farbe der bullischen Umkehr: Für Dreiecke, Rechtecke und bullische Zonen (Standard:
#2962FF- blau) - Farbe der bärischen Umkehr: Für Dreiecke, Rechtecke und bärische Zonen (Standard:
#FF9800- orange) - Farbe des bullischen Trends: Für Trendfilter-Visualisierung (Standard:
#089981- grün) - Farbe des bärischen Trends: Für Trendfilter-Visualisierung (Standard:
#F23645- rot)
🔧 TRENDFILTER
Der Indikator kann Muster basierend auf der allgemeinen Trendrichtung mit vier Methoden filtern:
1. Moving Average Cloud ☁️
Verwendet zwei gleitende Durchschnitte zur Identifikation des Trends:
Parameter:
- Typ des gleitenden Durchschnitts: Einfach, Exponentiell, Hull, Gewichtet, etc. (Standard: Hull)
- Schnelle Periode: 50 (Standard)
- Langsame Periode: 200 (Standard)
Filterlogik (Ausrichtung):
- Bullischer Trend erkannt, wenn: Preis > schneller GD UND schneller GD > langsamer GD ✅
- Bärischer Trend erkannt, wenn: Preis < schneller GD UND schneller GD < langsamer GD ✅
- Zeigt nur bullische Muster im bullischen Trend und bärische Muster im bärischen Trend
Gegenteilige Logik (Gegenteil):
- Invertiert die Bedingungen, um größere Gegen-Trend-Umkehrungen zu erfassen
2. Supertrend 📈
Volatilitätsbasierter Trendfolgeindikator (ATR):
Parameter:
- ATR-Periode: 10 (Standard) - Volatilitätsberechnungsfenster
- Multiplikatorfaktor: 3,0 (Standard) - Indikatorsensitivität
Logik:
- Berechnet obere und untere Bänder mit ATR
- Preis über Supertrend = bullischer Trend 🟢
- Preis unter Supertrend = bärischer Trend 🔴
- Filtert Muster entsprechend der konfigurierten Ausrichtung
3. Donchian-Kanäle 📊
Verwendet Preisextreme über einen Zeitraum:
Parameter:
- Kanal-Länge: 13 (Standard)
Logik:
- Oberer Kanal = höchstes Hoch der N Perioden
- Unterer Kanal = niedrigstes Tief der N Perioden
- Mittelpunkt = (oben + unten) / 2
- Preis über Mittelpunkt = bullischer Trend 🟢
- Preis unter Mittelpunkt = bärischer Trend 🔴
4. Keine (Kein Filter) 🔓
Zeigt ALLE erkannten 3-Bar-Muster ohne Berücksichtigung des Gesamttrends. Nützlich für:
- Seitwärtsmärkte
- Reine Musteranalyse
- Umkehrhandel in jedem Kontext
Trendausrichtung
Gilt, wenn der Filter aktiv ist:
- Ausrichtung: Zeigt nur Muster, die MIT dem erkannten Trend gehen ➡️
-
- Nur bullische Muster im bullischen Trend
- Nur bärische Muster im bärischen Trend
- Gegenteil: Zeigt nur Muster, die GEGEN den erkannten Trend gehen 🔄
-
- Bullische Muster im bärischen Trend (große Umkehr)
- Bärische Muster im bullischen Trend (große Umkehr)
Zusammenfassung
It operates in three phases: pattern detection, confirmation or invalidation based on the next candle's behavior, and establishing active support or resistance zones that extend while price respects them. The indicator supports configurable pattern modes (Normal, Enhanced, or All) to control acceptance criteria for reversals.
Trend filtering is available through four methods—Moving Average Cloud, Supertrend, Donchian Channels, or no filter—allowing users to align pattern signals with overall market trends or capture counter-trend reversals. Confirmed reversal zones are displayed as shaded rectangles or levels, customizable in color for bullish and bearish signals, trend filters, and zones.
This tool is designed for use on any timeframe and across various markets, including forex pairs (EURUSD, GBPUSD, USDJPY, NZDUSD), commodities (XAUUSD), indices (NAS100), and cryptocurrencies (BTCUSD). It aids traders in detecting high-probability reversals, filtering false signals, and identifying support and resistance zones with clear visual markers.


![„[Stellar Strategies] MARSI Signal Plotter“-Logo](https://cdn.ctrader.com/image/webp/7b2b8da6-8f8e-4646-8d4a-4710c516c01e_25567)