
AllPattern
Indikator
362 downloads
Version 1.0, Aug 2025
Windows, Mac
5.0
Bewertungen: 2
Beschreibung
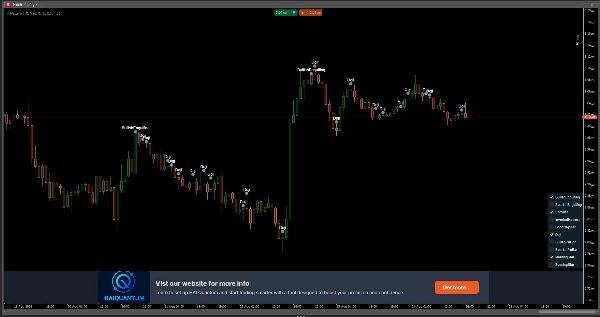
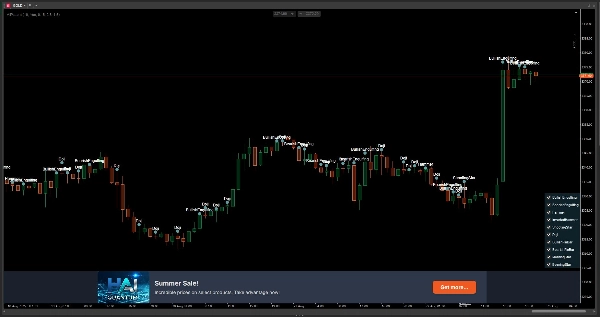
🔍 Entdecken Sie alle Candlestick-Muster… absolut kostenlos! 😀
Mit unserem Tool können Sie alle wichtigen Candlestick-Muster direkt in Ihrem Chart visualisieren. Von Doji bis Bullish Engulfing, einschließlich Hammer, Shooting Star und viele mehr.
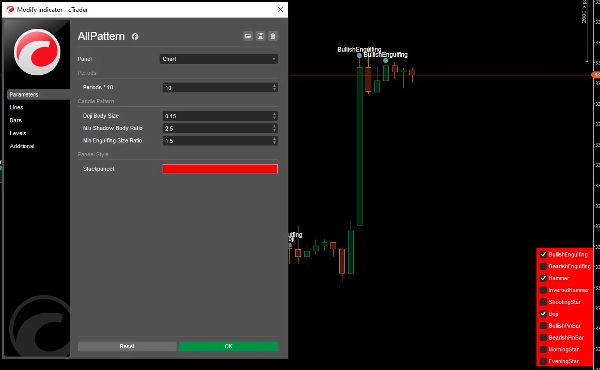
📌 Wie funktioniert es? Es ist einfach: Verwenden Sie das Panel rechts, um genau auszuwählen, welche Muster Sie anzeigen möchten. Schalten Sie sie ein oder aus, um Ihre Handelsstrategie anzupassen.
💸 Das Beste daran? Es ist völlig kostenlos! Keine Abonnements, keine Limits – nur reine, visuelle Analyse.
Zusammenfassung
Indikatorprofil
Kundenbewertungen
5.0
Bewertungen: 2
5 | 100 % | |
4 | 0 % | |
3 | 0 % | |
2 | 0 % | |
1 | 0 % |
Kundenbewertungen
October 8, 2025
Chart artist’s dream! 🧠 Spots triangles, wedges, flags — all in one go. Saves tons of time on manual pattern drawing. Great helper, but always double-check those breakouts!
Diskussion
Häufig gestellte Fragen (FAQ)
BTCUSD
Forex
Signal
Breakout
Indices
EURUSD
Commodities
GBPUSD
NZDUSD
Martingale
Prop
Scalping
Crypto
Grid
Stocks
AI
XAUUSD
NAS100
USDJPY
Über den cTrader Store verfügbare Produkte, einschließlich Handelsbots, Indikatoren und Plugins, werden von externen Entwicklern bereitgestellt und nur zu Informations- und technischen Zugriffszwecken verfügbar gemacht. cTrader Store ist kein Broker und erbringt keine Anlageberatung, persönlichen Empfehlungen oder eine Garantie für zukünftige Performance.


Preis
147
Verkäufe
11.17K
Kostenlose Installationen