Beschreibung
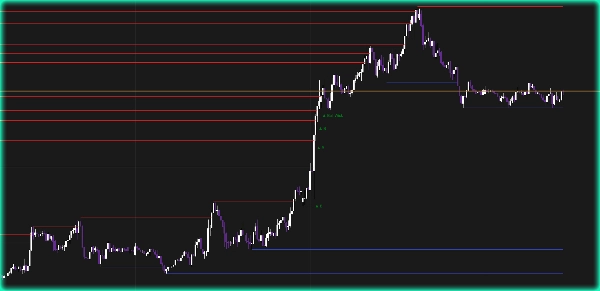
Unterstützungs- & Widerstandsniveaus mit Durchbrüchen von [BeyondTrading] — Sehen Sie jedes Live-Niveau und jeden echten Durchbruch. Erkennt automatisch Pivot-Hochs und -Tiefs und zeichnet horizontale Unterstützungs- und Widerstandslinien direkt im Chart. Jede Linie erstreckt sich Bar für Bar in Echtzeit, solange das Niveau hält. In dem Moment, in dem der Preis darüber schließt, stoppt die Linie — genau am Kontaktpunkt. Kein manuelles Zeichnen, keine veralteten Niveaus, die Ihren Chart überladen.
Wenn ein Niveau durchbrochen wird, erscheint sofort ein Signal: B für einen sauberen Durchbruch mit Volumen, Bull Wick oder Bear Wick wenn der Schlusskurs durch einen Docht und nicht durch einen echten Kerzenschluss getrieben wird. Der Volumenfilter eliminiert Bewegungen mit geringer Überzeugungskraft und behält nur die Signale, die wirklich zählen.
Warum S/R-Niveaus wichtig sind Unterstützungs- und Widerstandsniveaus sind nicht nur Linien — sie sind Liquiditätspools. Jedes Mal, wenn der Preis ein Niveau abgelehnt hat, sammeln sich Stop-Orders und ausstehende Orders knapp darüber und darunter an. Wenn der Preis zurückkehrt, kommen Institutionen entweder, um das Niveau zu verteidigen oder um die dort liegenden Stops zu jagen, bevor die eigentliche Bewegung beginnt. Ein Widerstandsniveau, das dreimal getestet und nie durchbrochen wurde, ist kein Zufall — dort sind Verkaufsorders gestapelt und Ausbruchshändler werden gefangen sein, wenn die Bewegung falsch ist. Zu wissen, welche Niveaus noch aktiv sind und welche bereits genommen wurden, zeigt Ihnen genau, wo die nächste Reaktion wahrscheinlich stattfinden wird.
Funktionen
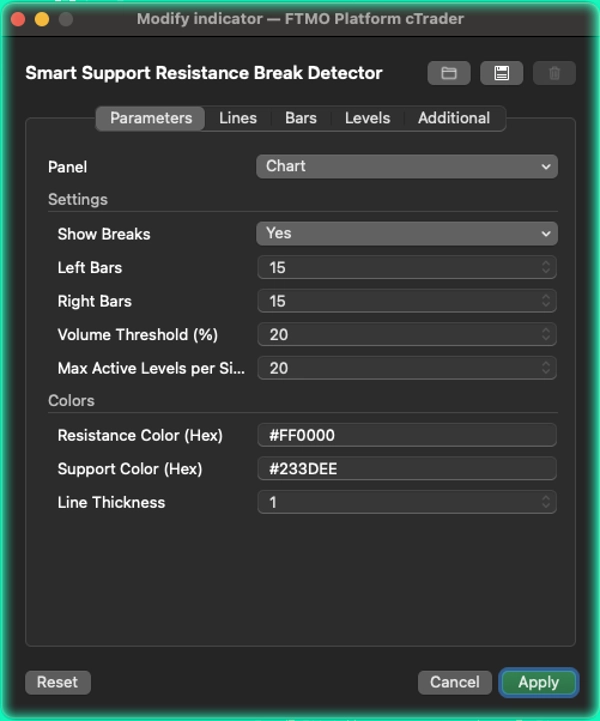
- Pivot-Erkennung mit konfigurierbaren linken und rechten Bars für jeden Handelsstil
- Linien verlängern sich dynamisch bei jedem Bar — sie stoppen sofort, wenn der Preis darüber schließt
- Volumenfilter (EMA 5/10 Oszillator) zur Unterscheidung echter Durchbrüche von Rauschen
- Durchbruch-Labels: B für saubere Volumendurchbrüche, Bull Wick und Bear Wick für dochtgetriebene Bewegungen
- Duplikatfilter — Niveaus, die zu nah an bestehenden liegen, werden automatisch ignoriert
- Maximale aktive Niveaus pro Seite, um den Chart sauber und übersichtlich zu halten
- Vollständig konfigurierbare Widerstands- und Unterstützungsfarben mit Hex-Eingabe
Zusammenfassung
The indicator features volume-confirmed break signals to distinguish genuine breakouts from low-conviction moves. It displays specific labels: "B" for clean volume breaks, and "Bull Wick" or "Bear Wick" when breaks are driven by wicks rather than body closes. A volume filter based on EMA oscillators helps filter out noise.
Additional functionalities include configurable pivot detection parameters (Left Bars and Right Bars), automatic filtering of duplicate levels, and limits on the maximum number of active levels per side to maintain chart clarity. Users can customize support and resistance line colors using hex codes.
This tool is designed to highlight key liquidity pools where institutional orders accumulate, aiding traders in identifying active levels and potential reaction points in the market.


![„[Stellar Strategies] Smart ADX“-Logo](https://cdn.ctrader.com/image/webp/af13b084-b6f6-41db-b7bc-c7e688b57b05_36929)