説明
▁▂▃▄▅▆▇ █ 10,000+ トレーダー(機関投資家+個人投資家) █ ▇▆▅▄▃▂▁
- cTraderで当社のTOPインジケーターを選択 🏆
- ✨ 優れた結果のための独占的な精度 ✨
- 📈 当社のアルゴリズム —最高評価のビジュアル🎯—
- は2つのクオンツファンドで成功裏に実装されています
▁▂▃▄▅▆▇ █████████████████████████████ ▇▆▅▄▃▂▁
_______________________________________________
_______________________________________________
📌 マーケット構造インジケーター
· ✅ AdvancedMarket Structure: Bos, Choch, SwinLevels, Order Blocks, Market Structure&流動性ファインダー
· 🔄 ダイナミックマーケット構造 ターニングポイントの分析
· 🧱 オーダーブロック
· ⚖️ マーケットアンバランス
· ⛓️ BOS & CHOCH
· 🧠 ICT Power of 3
· 🌀 マーケットポラリティゾーン
______________________________________________________________-
ストアcBots : 🧠 Gold & BTC ブレイクアウトセッションピボット 🧠
_______________________________________________
🔚 スマートエグジットシステム
· 📍 トレーリングスマートアルゴリズム
_______________________________________________
📐 ジグザグインジケーター
· 🔍 ジグザグ価格流動性投影
· 🧭 S&R構造ジグザグ
· ➖ ジグザグ
· 🎯 ジグザグ極端トラッカー
_______________________________________________
🧱 サポート&レジスタンスインジケーター
_______________________________________________
📊 トレンド&チャネルインジケーター
· 🔄 オートトレンドチャネル
· 📊 スーパートレンド
· 🧠 アダプティブトレンドチャネル
· 💥 チャネルブレイクアウトシステム
· ⭐ プレミアムSSLチャネル
· 🔁 リアクティブ移動平均
_______________________________________________
💧 ボリューム&流動性ツール
· 🔥 ボリュームPOCヒートマップ
· 📉 レバレッジ清算マップ
· 🔍 モメンタムフェアバリューギャップ
· 🕒 フェアバリューギャップセッション
_______________________________________________
⚡ モメンタム&RSIインジケーター
· 📈 RSIトレンドトリガー
· 🚀 ダイナミックレンジモメンタム
_______________________________________________
🔮 予測&投影ツール
· 📐 Linreg&ATRに基づく予測
______________________________________________________________________________________________________
リバーサル確率エンジン 🔄
リバーサルゾーンを検出するためのハイブリッドインジケーター+サポートとレジスタンスの多次元マッピング「ゴールデンレベル」。構造分析(フィボナッチウィンドウの高値/安値)、ダイナミクス(価格の速度と加速度)、エントロピー/カオス(秩序と無秩序)、モメンタム、ボリュームを組み合わせて以下を生成します:
- 時間軸ごとの階層的なサポート/レジスタンスレベル。
- 潜在的なリバーサル(ピークと谷)の確率的シグナルと%信頼度。⚠️
- トレードとストップの文脈化のためのアクティブゾーン(長方形)。
- 複数のタイムフレームが同じ価格で一致する場合のコンフルエンスクラスター。🎯
2. 目的
視覚的ノイズを減らし、以下を特定することで意思決定を容易にします:
- 価格が様々な時間軸で圧縮または固定されている場所。
- リバーサルの統計的確率が増加する場所(確認済みまたは予測)。📊
- 最も「重み」があるレベル(コンフルエンス)。
3. 概念的ロジック
a) レベル: 各フィボナッチウィンドウについて、最近の高値(R)と安値(S)を取得します。これにより、フラクタルスケールのコンテキスト(超短期からマクロ)が提供されます。
b) 融合: 複数の異なるレベルがXピップ以内にある場合、それらはグループ化され→結合ラベルとコンフルエンスカウントを持つクラスターになります。
c) リバーサルシグナル: 局所的な消耗パターン(波形)、減速(傾きの変化)、低エントロピーの減少(低エントロピー=反転しやすい方向性の動き)、可能な内部ダイバージェンス、モメンタム/ボリュームの検証を探します。
d) 予測モード: 逆加速度+低エントロピー+極端な状態が一致する場合、完全な確認前にリバーサル(ダイヤモンド)を予測可能にします。💎
e) 確率: 様々な要因(トレンド、カオス、モメンタム、ボリューム、ダイバージェンス、適応)の正規化された重み付け。結果は40~99%に切り捨て。
f) アクティブゾーン: シグナル後、最も論理的な範囲(関連レベル間)を探し、トレード管理とストップの文脈化を行います。
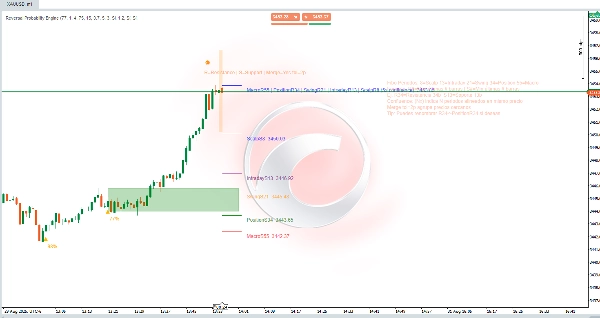
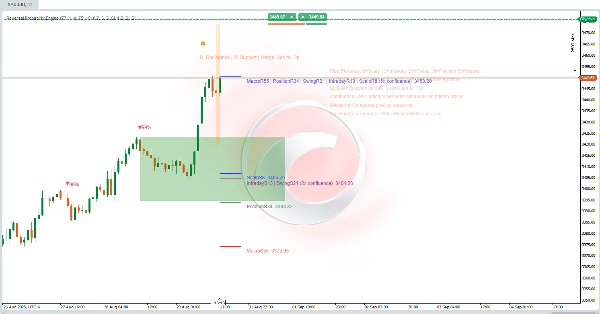
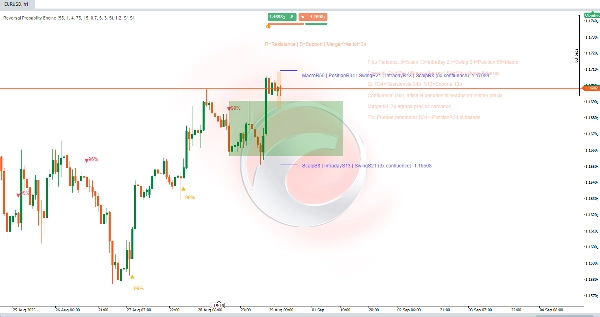
4. ビジュアルコンポーネント
- 水平線: 期間ごとのレベル(スカルプ8、イントラデイ13、スイング21、ポジション34、マクロ55)。時間軸ごとに一貫した色。
- R#/S#ラベル: R = レジスタンス(そのウィンドウの最近の高値)、S = サポート(最近の安値)。例:R34 = 最後の34本のローソク足から導出されたレジスタンス。
- 統合ラベル:
ScalpS8 | IntradayS13 | … (5x confluence) Price。N個の異なる期間が同じレベル(または許容範囲内)を示すことを意味します。多いほど関連性が高い。✅ - (Nx confluence): 一致する期間の数。
- Merge tol=Xp: 近接するレベルをグループ化するピップの許容範囲(飽和を回避)。
- 確率(%): 三角形(下/上)またはダイヤモンド(早期検出)の上/下のテキスト。
- 緑の長方形(アクティブゾーン): シグナル後の進展を評価する動的な運用チャネル。
- 追加の微妙なブロック/色: 有効化された場合のサポート要素(波/粒子)。
5. 実用的解釈
- 高いコンフルエンス(≥3x)= 強力な「磁石」またはピボットレベル。価格反応に注意。🧲
- シグナル+近接コンフルエンス 有効性を強化(ただし保証はしない)。
- 確率 ≥ 最小信頼度%: アクションを考慮するための最小フィルター。
- 予測(ダイヤモンド)と 対 確認済み(三角形): 予測はリスク/リワードが良好で誤検知率が高い。確認済みは非対称性が少なく、より多くの検証を伴う。
- 長方形: 価格が内部に留まり、反対側のエッジを無効にしない場合、仮説は生きている。明確なブレイクは期待を減少させる。
- MergeToleranceの拡大または縮小: 小さいほど粒度が高く、大きいほどより合成されたクラスター。
6. 使用フロー
- 希望の銘柄と時間軸にインジケーターをロードします。
- 許容度に応じて最小信頼度%を調整します(例:スカルピングは低め、スイングは高め)。
- 複数のサポート/レジスタンスクラスターが表示されるか確認します(5x、4xなど)。
- シグナルを待ちます(理想的にはクラスターの周辺で高確率で発生)。🔔
- アクティブゾーン内で管理を区切ります:段階的なエントリーまたは失敗したブレイクアウトの確認。
- 論理的なストップを定義します:コンフルエンスにない最初の下位(ロングの場合)または上位(ショートの場合)レベルを超えて。
- 使用しない期間を無効にします(例:ロングポジションはスイング/マクロのみ)。
- 許容度を調整し、学習後は説明パネルを非表示にすることも可能です。
7. クイックラベル読み取り例
ScalpS8 | IntradayS13 | SwingS21 | PositionS34 | MacroS55 (5x confluence)
意味: すべての時間軸(8~55)が同じフロアを共有 → マルチスケール構造サポート。反応の確率が高い;ボリュームを伴って失われた場合、より深刻なレジーム変化を意味します。🚨
概要
Key features include:
- Hierarchical support and resistance levels categorized by time horizons (from ultra-short scalp to macro scales).
- Probabilistic reversal signals indicating potential peaks and valleys with confidence percentages.
- Active zones displayed as rectangles to help contextualize trade entries and stop placements.
- Confluence clusters that highlight price levels confirmed across multiple timeframes, enhancing level significance.
The indicator reduces visual noise by grouping nearby levels within a tolerance range and provides clear visual components such as horizontal lines, labeled resistance/support points, merged confluence labels, probability percentages, and active zones. It distinguishes between anticipated and confirmed reversal signals, offering traders options for risk management and trade timing.
Users can adjust confidence thresholds and merge tolerances to tailor granularity and filtering according to their trading style and timeframe. The tool supports structured decision-making by identifying statistically significant reversal areas and multi-scale support/resistance clusters on any instrument and timeframe.
カスタマーレビュー
5 | 0 % | |
4 | 0 % | |
3 | 0 % | |
2 | 0 % | |
1 | 100 % |