
Penerangan
Supreme VWAP And Targets anchors a volume-weighted average price (VWAP) at every confirmed swing, waits for an impulse away from it, and prints a buy or a sell when price pulls back into the VWAP value band and reclaims it. Each signal comes with a complete trade plan: an entry, a stop beyond the pullback and three targets, drawn on the chart and followed bar by bar. Seven filter profiles judge every pullback, and an auto-optimizer shows the profile with the strongest record on your chart.
WHAT IT DRAWS
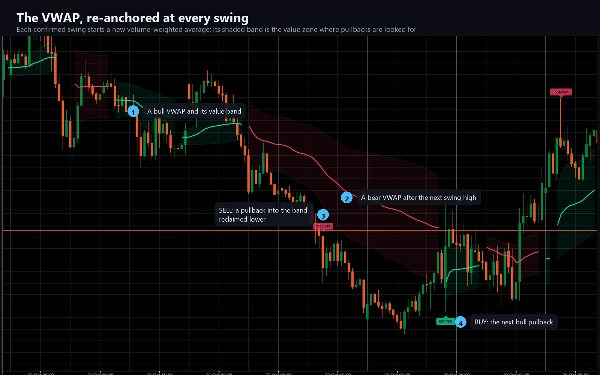
- The VWAP line of the current trend, solid, with a shaded value band around it, in the bullish or bearish colour, restarting at each new anchor.
- An anchor badge on the swing bar the VWAP is measured from.
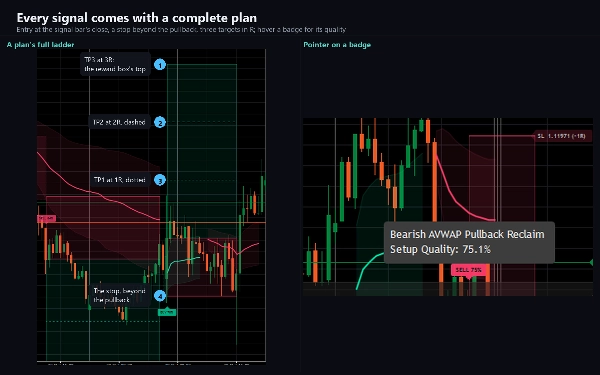
- BUY and SELL badges on the signal bar, each with its setup quality in percent. Hover a badge for its description and quality.
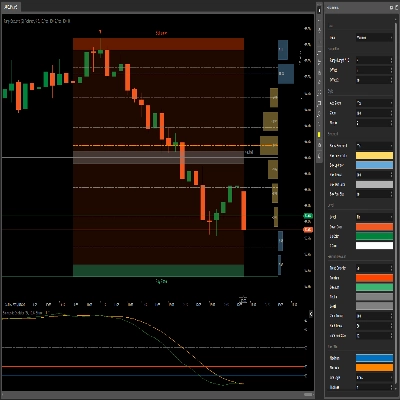
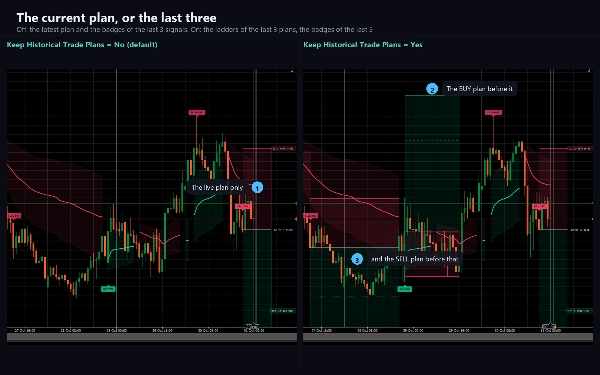
- The trade plan of the latest signal: a dotted box over the pullback, a risk box from the entry to the stop, a reward box up to the third target, and lines for the entry, the stop and three targets. Labels beside the plan give each price with its R multiple, a tick when a target is reached, a cross when the stop is, and BE once the stop has moved to the entry.
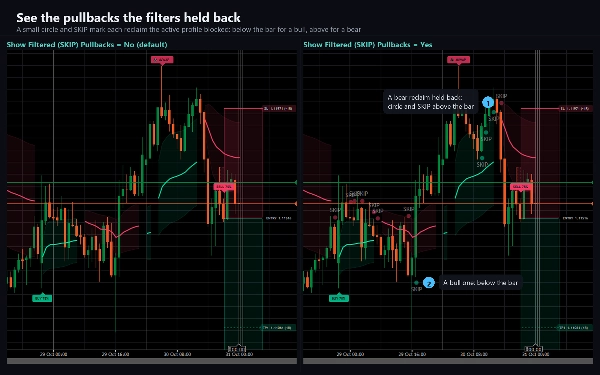
- Optional SKIP circles where a pullback reclaimed the band but the filters held it back.
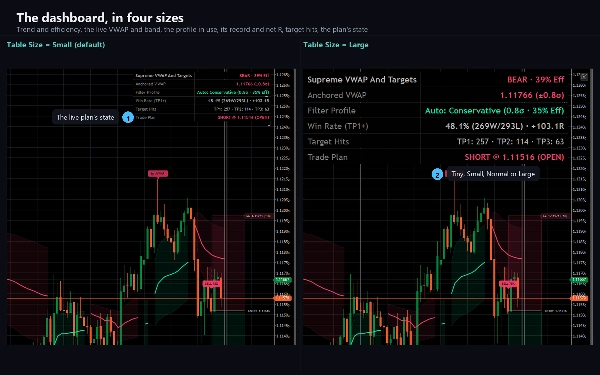
- A dashboard: the trend and its efficiency, the live VWAP and band width, the profile in use, its win rate with wins, losses and net R, how often each target was reached, and the state of the active plan.
HOW IT DECIDES
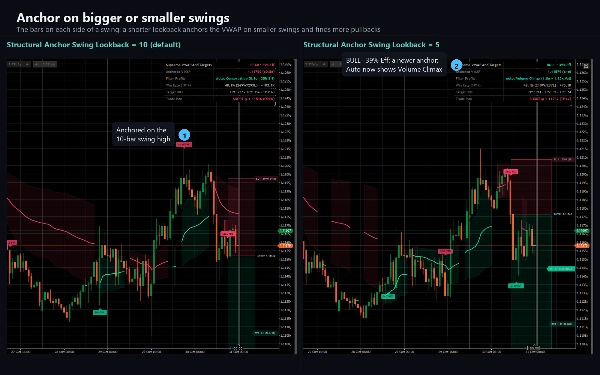
Swings are pivots with ten bars on each side by default. When a swing is confirmed, the VWAP is rebuilt from that swing bar, weighted by each bar's activity, and the value band is a number of weighted standard deviations around it. Once price has moved at least 1.4 ATR away from the anchor, a pullback into the band arms the setup, and a candle that closes back beyond the VWAP in the trend's direction, near the previous bar's extreme, is the signal, as long as the filters agree: the trend efficiency, a setup quality score, a pullback depth between 12 and 85 percent of the impulse, and a guard against sharp moves over five bars. By default each anchor can give at most 2 plans.
The stop sits beyond the pullback, plus a buffer in ATR, and the risk is kept between a floor and three ATR. Targets are one, two and three times the risk; by default, when the impulse high or low lies between 1.3 and 4.5 times the risk away, the second or third target moves onto it. After the first target the stop moves to the entry. A plan ends at its stop, at the third target, after 60 bars, or at the next signal.
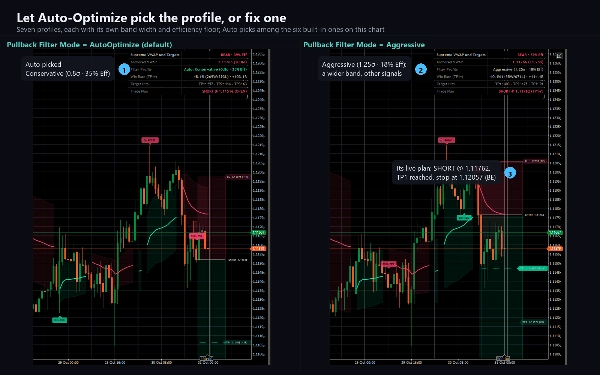
Seven profiles run side by side: Balanced, Conservative, Aggressive, Shallow Pullback, Deep Value Reclaim, Volume Climax and your own custom thresholds. Each sets its own band width and minimum trend efficiency. In auto mode the indicator shows the built-in profile with the highest win rate on the chart's history, out of the profiles with at least three closed plans; a plan counts as a win when it reached the first target or expired without a loss. Any profile can be fixed by hand as well.
Everything is decided when a bar closes: a signal, its plan and each target or stop event never change once printed.
HOW THE WIN RATE IS COUNTED
The dashboard's win rate and net R come from every plan the profile in use has opened on this chart's history, and a plan closes in one of four ways. A plan that reaches the third target is a win and banks its full R. A plan that reaches the first target and is then stopped is also a win, because the stop has moved to the entry by then; it banks half the R of the targets it reached. A plan that is stopped before the first target is a loss of one R. A plan that is still open sixty bars after its entry, with neither the stop nor the third target reached, expires at the close of that bar: if the first target had been reached it is a win and banks the first target's R; if not, it is counted as a win when its open result at that bar is zero or better and as a loss when it is below zero, and its open result is what is booked. So an expired plan that is slightly in profit, or at breakeven, counts as a win even though it never reached a target. The counts of TP1, TP2 and TP3 on the dashboard show how many plans actually reached each target, which is the stricter reading, and net R sums what every plan booked. None of these figures includes spread, commission or slippage.
KEY SETTINGS
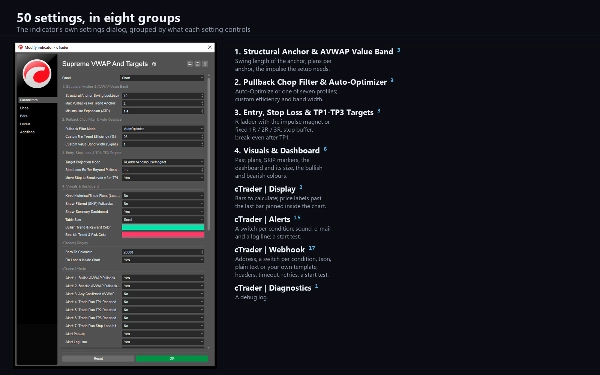
50 settings in eight sections: the anchor and the impulse, the filter profiles and custom thresholds, the stop and targets, the visuals and the dashboard, and groups for display, alerts, the webhook and diagnostics. One setting decides how much history the profiles are measured over (20,000 bars by default).
ALERTS AND WEBHOOK
Seven conditions, each with its own switch: a BUY, a SELL, either signal, each of the three targets reached, and the stop reached. Each arrives as a log line, a sound of your choice and e-mail, and a test on start checks your settings without waiting for a signal. Nothing fires while the indicator walks the chart's history, and nothing fires in a backtest.
A webhook posts the same seven conditions, each with its own switch, to any address you enter: a chat bot, a journal, an automation flow or your own server. Choose a JSON body with the bar, the direction, the entry, the stop, the three targets with their R multiples, the risk, the setup quality, the profile and its win rate, the plain alert sentence, or your own template with 21 placeholders. Add an access key header and one more header of your own. A post that gets no success answer is sent again, and a test on start checks the address. It stays off until you enter one, is sent once per condition per bar, is capped at twenty messages a minute, and a failure is logged rather than thrown. It sends through cTrader's own networking service, which is why the indicator needs no file or network access rights at all.
TYPE AND WINDOW
An overlay indicator: everything is drawn on the price chart, and it adds no separate pane. The plan's price labels sit six bars past the last bar, and cTrader leaves little room there, so they are kept inside the chart by default while the last bar is in view; one switch places them at their designed spot.
TIMEFRAMES AND INSTRUMENTS
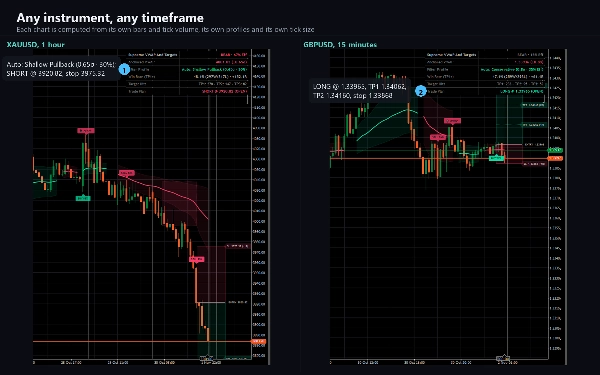
Any timeframe from one minute to daily and any instrument: forex pairs, metals, indices and crypto. Prices are written to your broker's own tick. When it attaches, the indicator loads the history it needs, up to the history setting.
USE CASES
- Trading pullbacks in a trend to its swing anchor VWAP, with the plan drawn for each signal.
- Letting the auto-optimizer choose the filter profile that has worked best on the symbol and timeframe in front of you, or fixing your own.
- Managing a trade by its plan: a stop, three targets and the move to break-even after the first.
- Reviewing how each profile has done on the chart's history from the dashboard.
- Being told by log line, sound, e-mail or webhook when a signal prints or a target or the stop is reached.
WHO IT IS FOR
Traders who use VWAP and trend pullbacks and want their entries, stops and targets found and planned by fixed rules rather than drawn by hand.
TECHNICAL NOTES AND LIMITATIONS
Access rights: none. The indicator cannot read files, start processes or open connections of its own.
It is a charting and analysis tool. It does not place orders and it has no access to your account.
The VWAP, the activity check and the setup quality use your broker's prices and tick volume, so another feed can time a signal differently. The win rates on the dashboard describe the chart's past plans and are not a win probability. The profiles are measured over the bars in the history setting, so a different depth there can choose a different profile.
SUPPORT
Questions go through the Discussion tab. Include your broker, symbol, timeframe, cTrader version and a screenshot of the full chart, and you will get a useful answer first time.
Trading involves risk. Past performance does not guarantee future results.