
Descrizione
Imperium MTF Heatmap è un indicatore unico di alto livello per cTrader, creato per i trader che vogliono più dei segnali — vogliono il controllo del mercato, chiarezza visiva e un reale valore nel trading.
Questo indicatore è progettato per rivelare la vera struttura del movimento di mercato a breve termine combinando l'allineamento multi-timeframe, la logica della media mobile, la forza direzionale e il comportamento di conferma in un potente sistema heatmap.
Il suo più grande vantaggio non è solo ciò che mostra, ma quanto rapidamente e chiaramente lo mostra. Nei mercati veloci, le decisioni devono essere prese all'istante. Imperium MTF Heatmap ti aiuta a identificare la pressione rialzista e ribassista, confermare la qualità del momentum e individuare l'allineamento tra i livelli chiave senza sovraccaricare il grafico con rumore inutile.
Le impostazioni predefinite sono specificamente ottimizzate per Tick30 e Minute1, rendendo questo indicatore eccezionalmente prezioso per i trader attivi che operano in ambienti veloci e basati sulla precisione. Dal momento in cui lo applichi, è pronto a funzionare.
Questo è un indicatore premium con una reale capacità di durata.
È il tipo di strumento che diventa rapidamente parte della tua routine di trading perché ti fornisce informazioni difficili da ignorare una volta viste in azione.
Molti indicatori vengono usati per un po' e poi rimossi.
Imperium MTF Heatmap è diverso.
Offre un vantaggio visivo così pratico e immediato che diventa naturalmente uno di quegli indicatori a cui torni ogni giorno. Una volta che è sul tuo grafico e inizi a leggere il mercato attraverso di esso, fare trading senza sembra perdere uno strato importante di consapevolezza.
Se vuoi un indicatore unico, potente e veramente utile per il trading su Tick30 e Minute1, Imperium MTF Heatmap è esattamente quello.
Come usare Imperium MTF Heatmap
Imperium MTF Heatmap è progettato per aiutarti a leggere la direzione, la forza e l'allineamento del mercato in modo rapido e visivo.
Invece di affidarti a più indicatori separati, ti offre una panoramica istantanea della pressione del trend su più livelli.
Alla base, l'indicatore mostra se il mercato è orientato al rialzo o al ribasso, quanto è forte quella pressione e se le diverse righe sono allineate. Questo rende molto più facile individuare condizioni di trading di alta qualità ed evitare setup deboli o rumorosi.
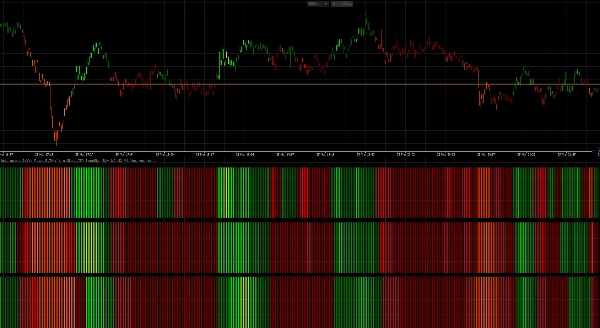
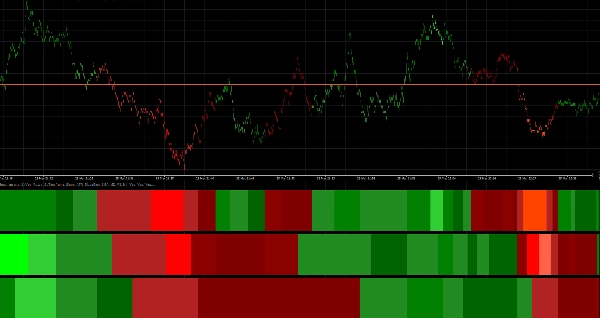
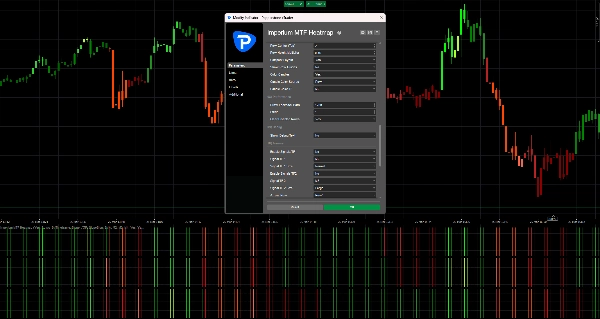
Cosa mostra la heatmap
La heatmap è costruita con 3 righe, e ogni riga rappresenta un timeframe separato o un livello di media mobile a seconda del tuo layout.
- Zone verdi indicano pressione rialzista
- Zone rosse indicano pressione ribassista
- Intensità del colore più brillante / più forte significa momentum o forza del trend più forte
- Condizioni deboli o instabili appaiono meno potenti e dovrebbero essere trattate con maggiore cautela
Quando più righe sono allineate nella stessa direzione, il mercato di solito ha una struttura migliore e un momentum più pulito.
È lì che l'indicatore diventa particolarmente prezioso.
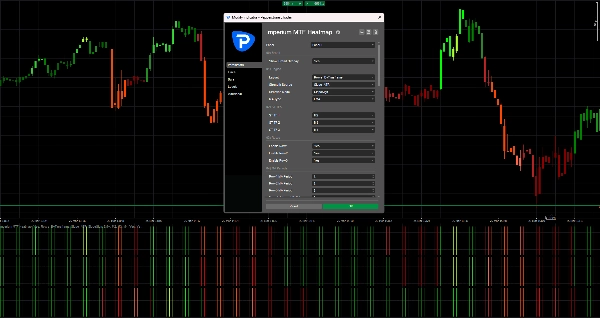
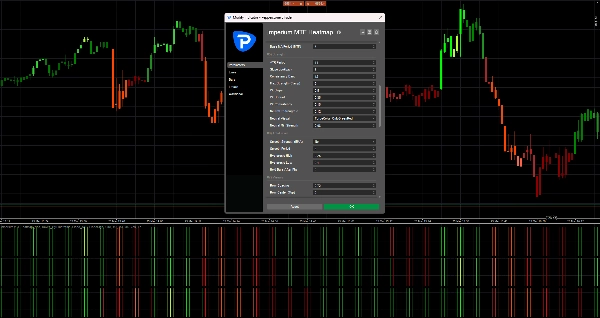
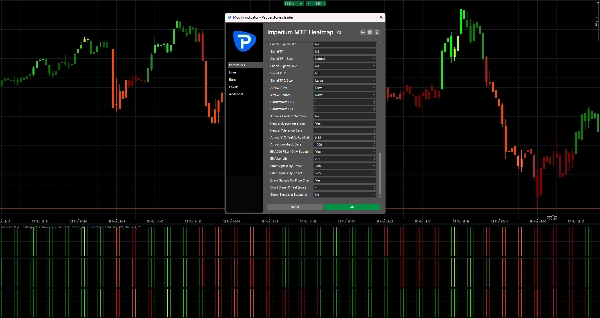
Configurazione predefinita
Le impostazioni predefinite sono ottimizzate per:
- Tick30
- Minute1
Questo significa che l'indicatore è pronto all'uso immediatamente per ambienti di trading veloci come scalping e trading intraday a breve termine.
Struttura predefinita:
- Riga 1 = M2
- Riga 2 = M3
- Riga 3 = M4
Questo crea una vista multi-timeframe compatta che ti aiuta a giudicare rapidamente se il momentum a breve termine è supportato dai livelli successivi sopra di esso.
Come leggere l'indicatore
1. Guarda prima la Riga 1
La Riga 1 ti dà la lettura più veloce sulla direzione a breve termine e sulla pressione immediata.
Usa la Riga 1 per rispondere a:
- Il momentum è attualmente rialzista o ribassista?
- C'è pressione attiva nel mercato in questo momento?
- Il movimento è forte o debole?
La Riga 1 è il primo strato di informazione, ma non dovrebbe sempre essere usata da sola per il trading.
2. Usa la Riga 2 e la Riga 3 per conferma
La Riga 2 e la Riga 3 fungono da filtri.
Se la Riga 1 diventa verde ma la Riga 2 e la Riga 3 rimangono rosse, il movimento potrebbe essere debole, precoce o semplicemente un ritracciamento di breve durata.
Se tutte le righe si allineano nella stessa direzione, di solito segnala una struttura più forte e una qualità di trading migliore.
Regola generale:
- 1 riga allineata = segnale precoce
- 2 righe allineate = conferma più forte
- 3 righe allineate = confluenza direzionale di massima qualità
Modo migliore per usarlo nel trading
Setup rialzista
Un setup rialzista più forte è quando:
- La Riga 1 è verde
- La Riga 2 è verde
- La Riga 3 è verde
- l'intensità del colore è solida o in aumento
- l'azione del prezzo supporta la continuazione
Questo ti dice che la pressione rialzista non è isolata, ma supportata dall'intera struttura della heatmap.
Setup ribassista
Un setup ribassista più forte è quando:
- La Riga 1 è rossa
- La Riga 2 è rossa
- La Riga 3 è rossa
- l'intensità del colore è solida o in aumento
- l'azione del prezzo supporta la continuazione al ribasso
Questo suggerisce un controllo ribassista e una migliore probabilità per entrate short o trade di continuazione.
Approccio pratico al trading
Un modo semplice per usare Imperium MTF Heatmap:
Stile di ingresso aggressivo
Entra quando:
- La Riga 1 cambia fortemente colore
- La Riga 2 inizia a supportare il movimento
- il momentum si costruisce rapidamente
Questo stile offre ingressi anticipati, ma anche più rischio.
Stile di ingresso conservativo
Entra solo quando:
- La Riga 1, la Riga 2 e la Riga 3 sono allineate
- il colore è stabile e forte
- il movimento è supportato da un'azione del prezzo pulita
Questo stile offre meno ingressi, ma spesso di qualità migliore.
Colorazione delle candele
L'indicatore può anche colorare le candele in base alla direzione della heatmap.
Questo ti aiuta a:
- rimanere visivamente allineato con il bias attuale
- evitare di fare trading contro la pressione attiva
- leggere il mercato più velocemente senza controllare ogni riga manualmente
Con le impostazioni predefinite, la colorazione delle candele è collegata a M2, che si adatta bene alla logica di trading veloce dei grafici Tick30 e Minute1.
Frecce di segnale
Se abilitate, le frecce di segnale possono aiutare a evidenziare potenziali opportunità di acquisto e vendita.
Queste frecce non sono pensate per sostituire la lettura del mercato.
Funzionano meglio se usate insieme all'allineamento della heatmap.
Buone pratiche:
- Usa le frecce solo nella direzione del bias completo della heatmap
- Dai più valore alle frecce quando la Riga 2 e la Riga 3 confermano la Riga 1
- Ignora le frecce durante condizioni di heatmap miste o contrastanti
Nelle tue impostazioni predefinite attuali, le frecce di segnale sono disattivate off, il che mantiene il grafico pulito e concentra l'attenzione sulla heatmap stessa.
Cosa evitare
Non usare l'indicatore ciecamente.
Evita di fare trade quando:
- le righe sono miste
- i colori sono deboli e instabili
- la direzione della heatmap cambia rapidamente
- il mercato è agitato o in range
- l'azione del prezzo è chiaramente in disaccordo con la struttura della heatmap
L'indicatore è più forte quando viene usato come strumento di supporto decisionale, non come sistema di ingresso automatico standalone.
Casi d'uso migliori
Imperium MTF Heatmap è particolarmente efficace per:
- scalping
- trading di momentum a breve termine
- entrate di continuazione del trend
- conferma di ritracciamenti
- analisi di confluenza multi-timeframe
- filtraggio di trade deboli
- mantenersi allineati con la pressione del mercato
Perché i trader continuano a usarlo
Questo indicatore diventa potente perché comprime molte informazioni importanti del mercato in una lettura visiva rapida.
Una volta che inizi a usarlo regolarmente, inizi a notare:
- la direzione più velocemente
- la forza più chiaramente
- l'allineamento con più sicurezza
- setup deboli prima
- tempismo migliore nei mercati attivi
Ecco perché spesso diventa uno di quegli indicatori che i trader tengono sempre sul loro grafico.
Regola semplice da ricordare
Allineamento verde = cerca acquisti
Allineamento rosso = cerca vendite
Heatmap mista = aspetta
Questo singolo principio rende già l'indicatore altamente pratico.
Riepilogo
Traders use the heatmap to quickly assess market direction, momentum quality, and alignment across multiple layers, aiding in identifying high-quality trade setups and filtering out weak or noisy conditions. The indicator supports both aggressive and conservative entry styles based on the alignment and strength of the heatmap rows. It can also color candles according to the dominant heatmap direction for faster market reading.
Optional signal arrows highlight potential buy and sell opportunities but are intended as a supplement to heatmap analysis rather than standalone signals. Imperium MTF Heatmap is particularly suited for scalping, short-term momentum trading, trend continuation, pullback confirmation, and multi-timeframe confluence analysis across various markets including Forex, indices, commodities, stocks, and cryptocurrencies. It functions as a decision support tool to enhance market awareness and timing in active trading environments.
Recensioni dei clienti
5 | 50 % | |
4 | 50 % | |
3 | 0 % | |
2 | 0 % | |
1 | 0 % |


