


Description
La configuration de day-trading la plus éprouvée, entièrement automatisée sur votre graphique.
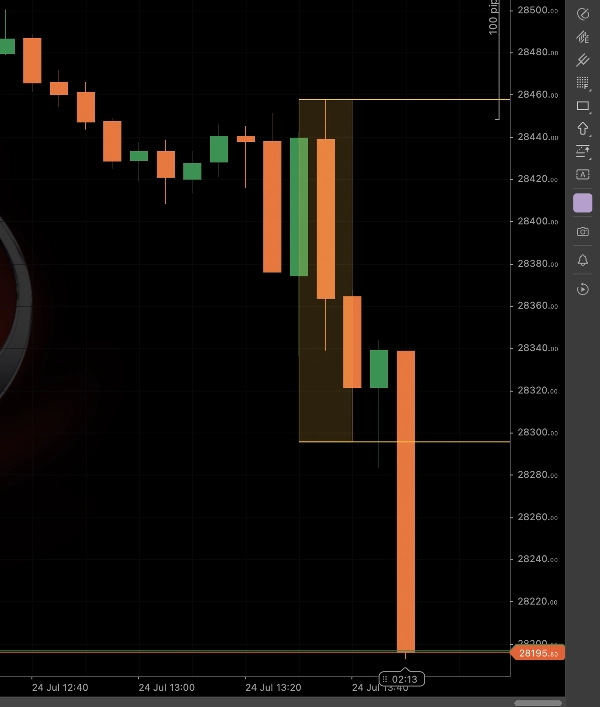
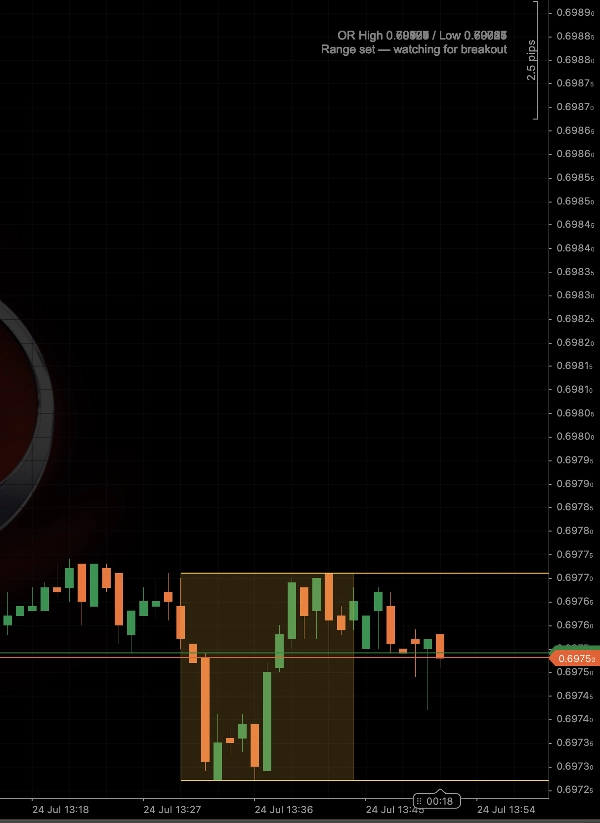
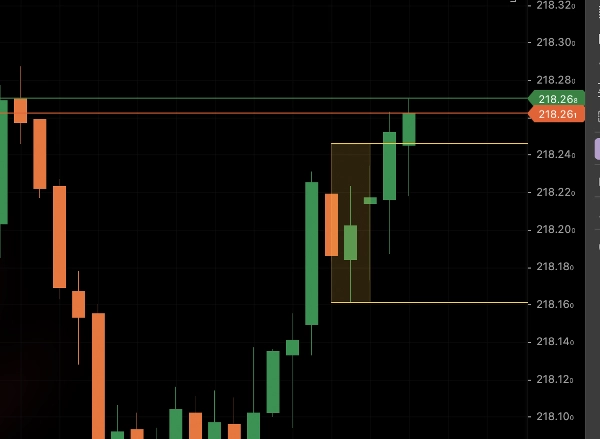
Opening Range Breakout trace le plus haut et le plus bas des premières minutes après l'ouverture de la séance, puis vous indique le moment où le prix s'engage dans une véritable cassure — pas seulement une mèche traversant le niveau.
Ce qu'il analyse :
- Plage d'ouverture — le plus haut/le plus bas d'une fenêtre configurable juste après le début de votre séance (par défaut : 9h30 ET, 15 minutes — l'ouverture classique de la NYSE ORB)
- Confirmation de cassure — ne se déclenche que sur une clôture complète de la bougie au-delà de la plage, filtrant les faux signaux qui ne font que traverser avec une mèche avant de revenir
- Filtre de hausse de volume — exige optionnellement que le volume de la bougie de cassure dépasse un multiple de la moyenne récente, afin que vous tradiez la conviction, pas le bruit
Comment le lire : la plage s'affiche comme une boîte ombrée avec deux lignes prolongées pendant sa formation. Dès qu'une cassure valide est confirmée, toute la boîte et les deux lignes passent en vert vif (achat) ou rouge vif (vente), avec une étiquette claire "LONG BREAKOUT" / "SHORT BREAKDOWN" directement sur la bougie signal. Fonctionne aussi sur tout l'historique de votre graphique, vous permettant de revenir en arrière et de voir exactement comment la plage de chaque séance précédente s'est déroulée.
Paramètres clés : Heure de début OR (ET), Durée OR (minutes), Multiplicateur de volume, longueur de l'extension de ligne, et un interrupteur pour la boîte ombrée.
Idéal pour : les traders intraday sur des unités de temps plus courtes (1–15 min) tradant des actions, indices ou futures avec une ouverture de séance définie — c'est la configuration la plus mécanique et basée sur des règles dans le day trading de détail, et cet outil élimine entièrement le dessin manuel de la plage et l'observation des cassures.
Résumé
Avis clients
Discussion
Questions fréquentes
Plus de cet auteur












Vous pourriez aussi aimer















Prix